Industrial Equity Mapper
Stories of Industrial Pollution in the U.S.
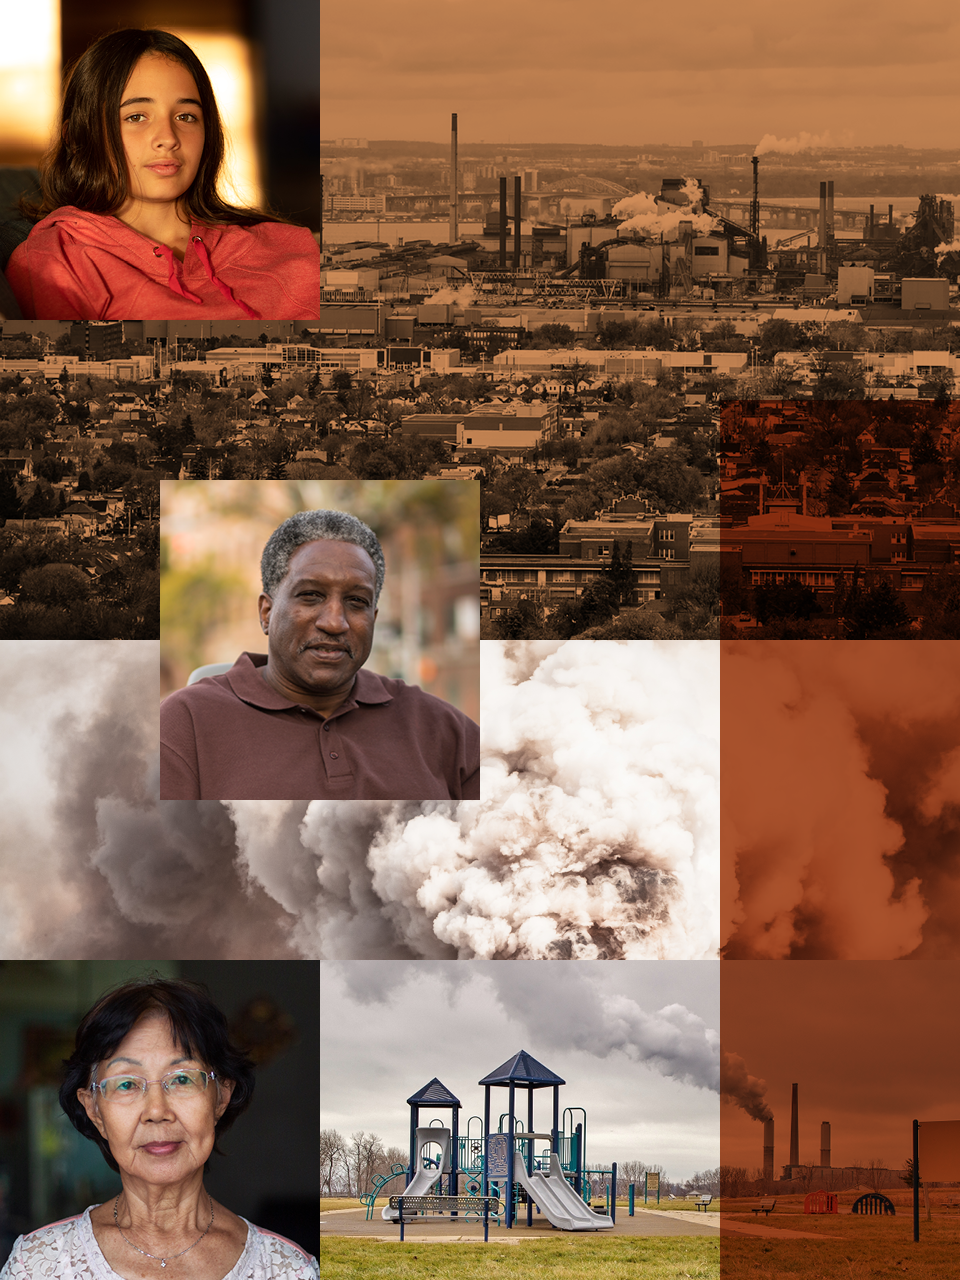
Access to data proving how industry has polluted communities is the first step toward empowering individuals to take action for their futures.
Introduction
America’s industrial past is complicated. Steel, aluminum, and other manufacturing industries are often celebrated for expanding the middle class and powering economic growth throughout the 19th and 20th centuries, helping the United States become the world’s largest economy.
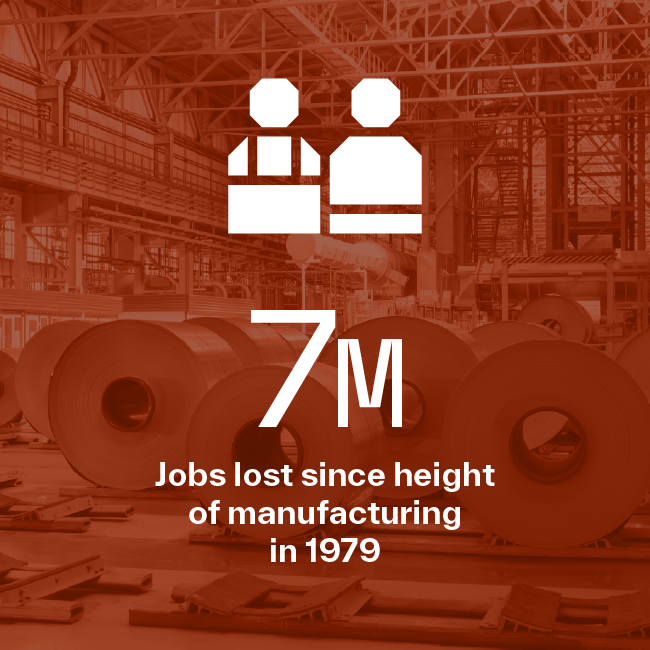
But this simple narrative leaves out a great deal. Unions — not industry alone— built the middle class, but industry’s prosperity often excluded Black people, immigrants, and people who lived near these facilities. For many of these communities, instead of opportunity, industrial production brought environmental and health burdens and pollution that was under-monitored, under-reported, and that continues to heat the planet. In recent decades, many facilities have closed, unable to compete against international imports or in pursuit of lower labor costs overseas.
So, where do we go from here? Building a better future starts with better data and using storytelling to build a powerful vision and a more honest story of industrial transformation — a future for industry that breaks with our past — might look like.
The Industrial Equity Mapper: Stories of Industrial Pollution in the U.S. sits at the intersection of heavy industry and justice, delivering concrete data and storytelling to put power back into the hands of everyday people. It analyzes a range of health, demographic, economic, and pollution data with dozens of interviews of industry’s impact on communities. This work builds on the decades-long efforts of communities that have fought for better monitoring, greater transparency, and accountability from industry.
The Industrial Equity Mapper is the first analysis of its kind, with a focus on measuring the specific impacts of industry and its operations. It allows communities in some of the most impacted geographies to find raw facts and moving stories that speak to their direct experiences and the severe risks they face from exposure to toxic pollution from industrial manufacturing.
The Industrial Equity Mapper
Explore the Industrial Equity Mapper below. For an overview of how to use the tool, watch this tutorial or read these instructions. If you are interested in the project's methodology, read more.
What we learned
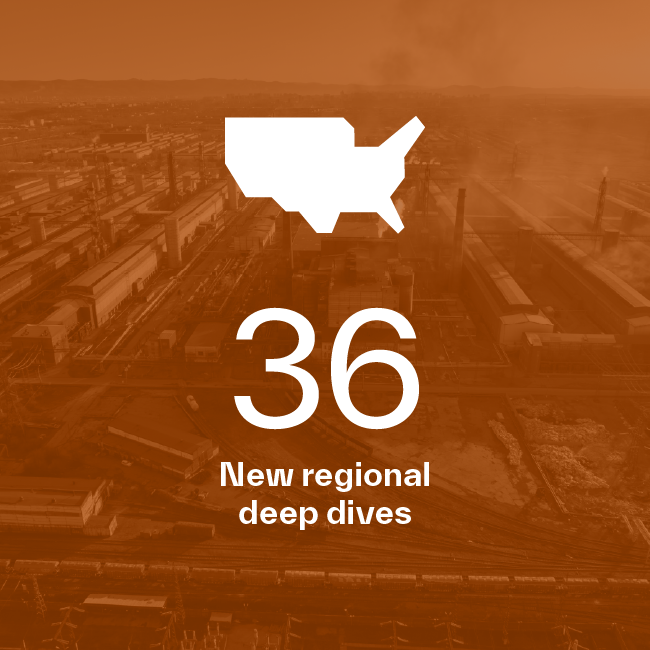
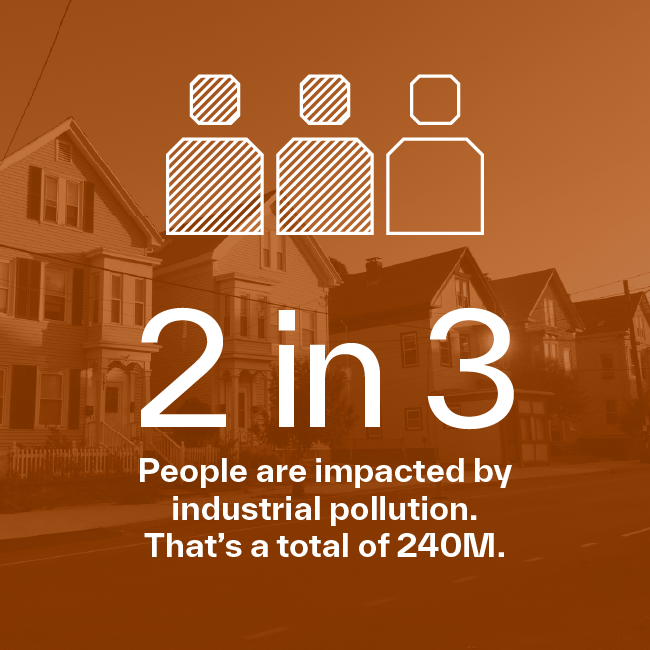
Across the country, Industrious Labs spoke with dozens of community leaders, organizers, and people living near facilities. The infographic below illustrates some of the socioeconomic factors and environmental burdens of heavy industry in these regions.
The Impact of Heavy Industry
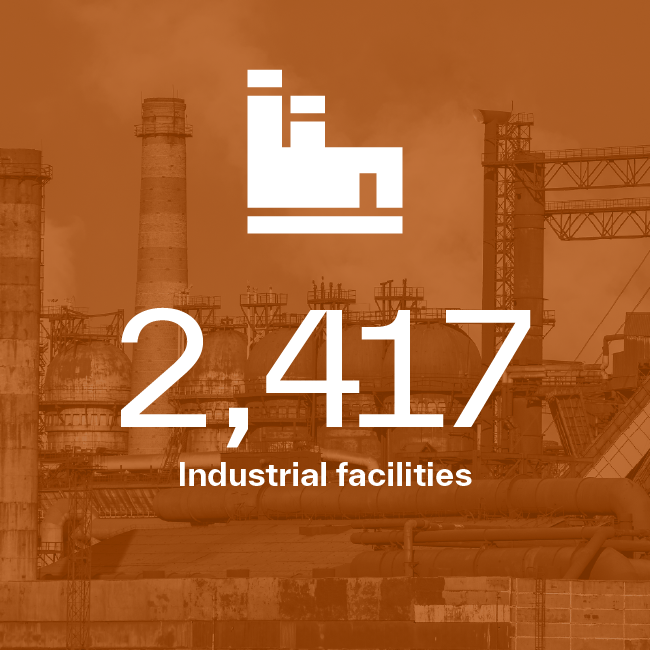
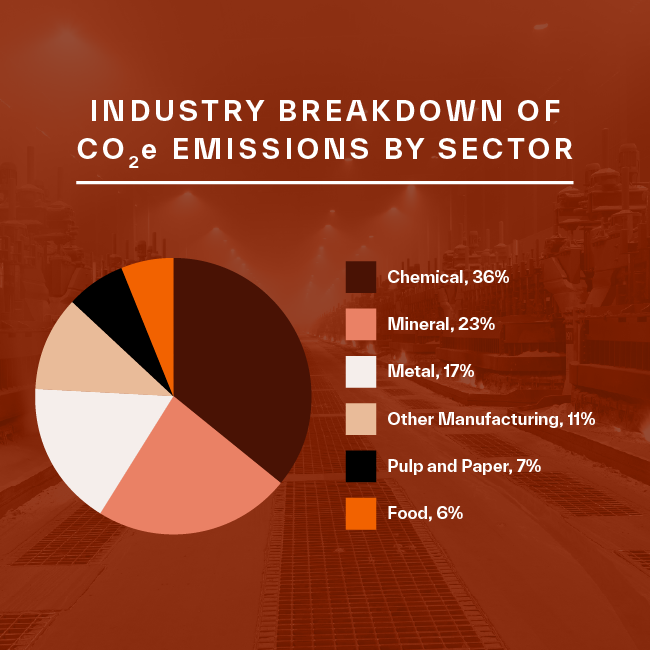
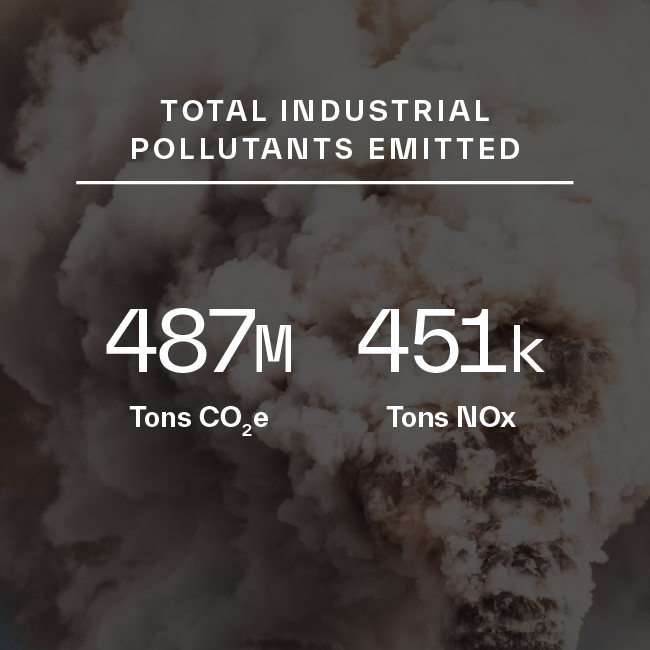
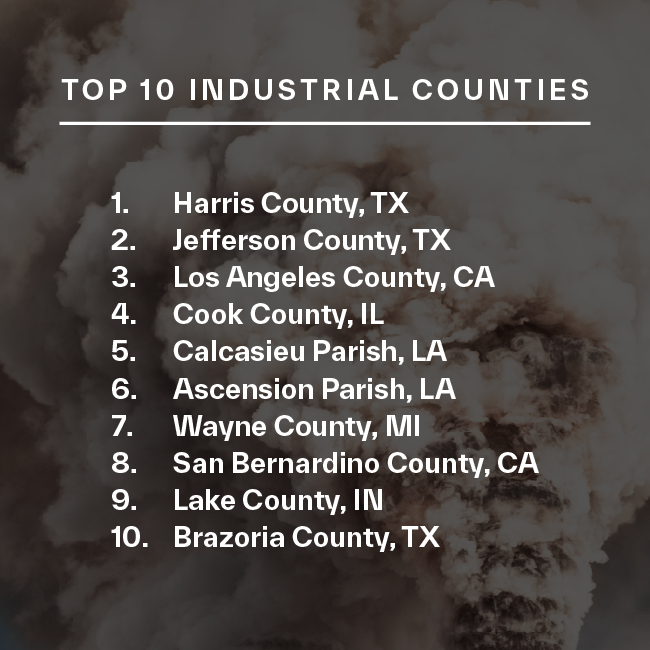
Pollution burden is not spread evenly across the country – it compounds. The 10 counties with the highest density of large polluting facilities – nearly 200 in total – are home to communities that are 73% Black, Indigenous, or People of Color, nearly double the national average, and poverty rates that run well above the national average. This confirms what community members have told us directly; living next to industry, and the harm that comes with it, is not accidental. Given the generations of communities who have been dealing with systems that reinforce harm, communities are very astute at identifying what industrial transformation looks like for them.
Each community’s vision for a transformed manufacturing sector is different. Unsurprisingly, there is no singular narrative. Some want to make systems and alternatives so no one can be sacrificed or feel disposable. Others want to bring old and young folks together to stand up and fight. All of these communities paint a clear vision of what transformation looks like for them, what is required to win, and industrial transformation is centered in shifting the material conditions of those most impacted.
A vision for transformation
Transforming industry is one of the defining projects of the next decade and beyond. Manufacturing materials like cement and steel are essential to building the wind turbines, subway lines, and heat pumps we need to tackle climate change— but how they are made must change.
Communities are not monolithic. Each has its own vision for transformation, shaped by unique histories, priorities, and lived experiences. When we asked participants about their long term vision, we heard a wide range of goals: stronger and locally sustained community services, thriving economies with more locally owned industry, good jobs with livable wages, accountable local government, removal or relocation of polluting facilities, environmental cleanup and repair of harm, direct industry investment in workers and neighborhoods, and in some cases, reparations. Across these geographies, communities were clear: they know what they need to thrive in the long term.
Sometimes, these goals align across regions; other times, they are in tension. That tension is natural. What matters most is that as efforts to decarbonize and transform industry accelerate, communities must have more than a seat at the table — they must have real power to chart their own futures. In some places, that might mean building a new green steel or zero-emissions paper mill. In others, it could mean moving away from heavy industry altogether and focusing on deep, community-led priorities.
Uplifting community stories and experiences offers a more complete picture of how industry impacts those living and working near industrial facilities today. Frontline communities that have historically borne the brunt of environmental injustice, especially Black and Brown families, will continue to feel the disproportionate impacts of these industries if industrial transformation is delayed. Working people and families who once built their futures around manufacturing – a sector that represented nearly 39% of total employment in the 1940s have watched that foundation crumble beneath them as employment fell to a mere 8% by the end of 2024. These communities, hollowed out by decades of disinvestment, will continue to bear the weight of this decline unless meaningful action follows empty promises of tariffs and corporate tax breaks.
Because visions for the future and the tools to get there vary from place to place, Industrious Labs takes on a technology and solution-neutral approach. The inclusion of any specific project in our work is not an endorsement or rejection. We know that some decarbonization tools may be embraced in one community and opposed in another. Our role is to bring transparency, ensure data and analysis are available and accessible, and work collaboratively so communities can fully assess potential benefits, harms, and unintended consequences — enabling decisions that are informed, democratic, and aligned with their priorities.
The path to industrial transformation will involve complex trade-offs, competing visions, and uncomfortable realities. By building strong, trust-based relationships with those most impacted, holding ourselves and our movement accountable to shared values, and staying honest about trade-offs and risks, we can help shape a transition that is just, equitable, and rooted in frontline needs. This challenge and the opportunity it holds is exactly why Industrious Labs exists. This mapping project was created to offer a clearer, more complete picture of what industrial transformation means on the ground, and to illuminate the pathways for how we get there together.
Case studies
Click below to read the case studies that include historical context and experiences of impacted communities:
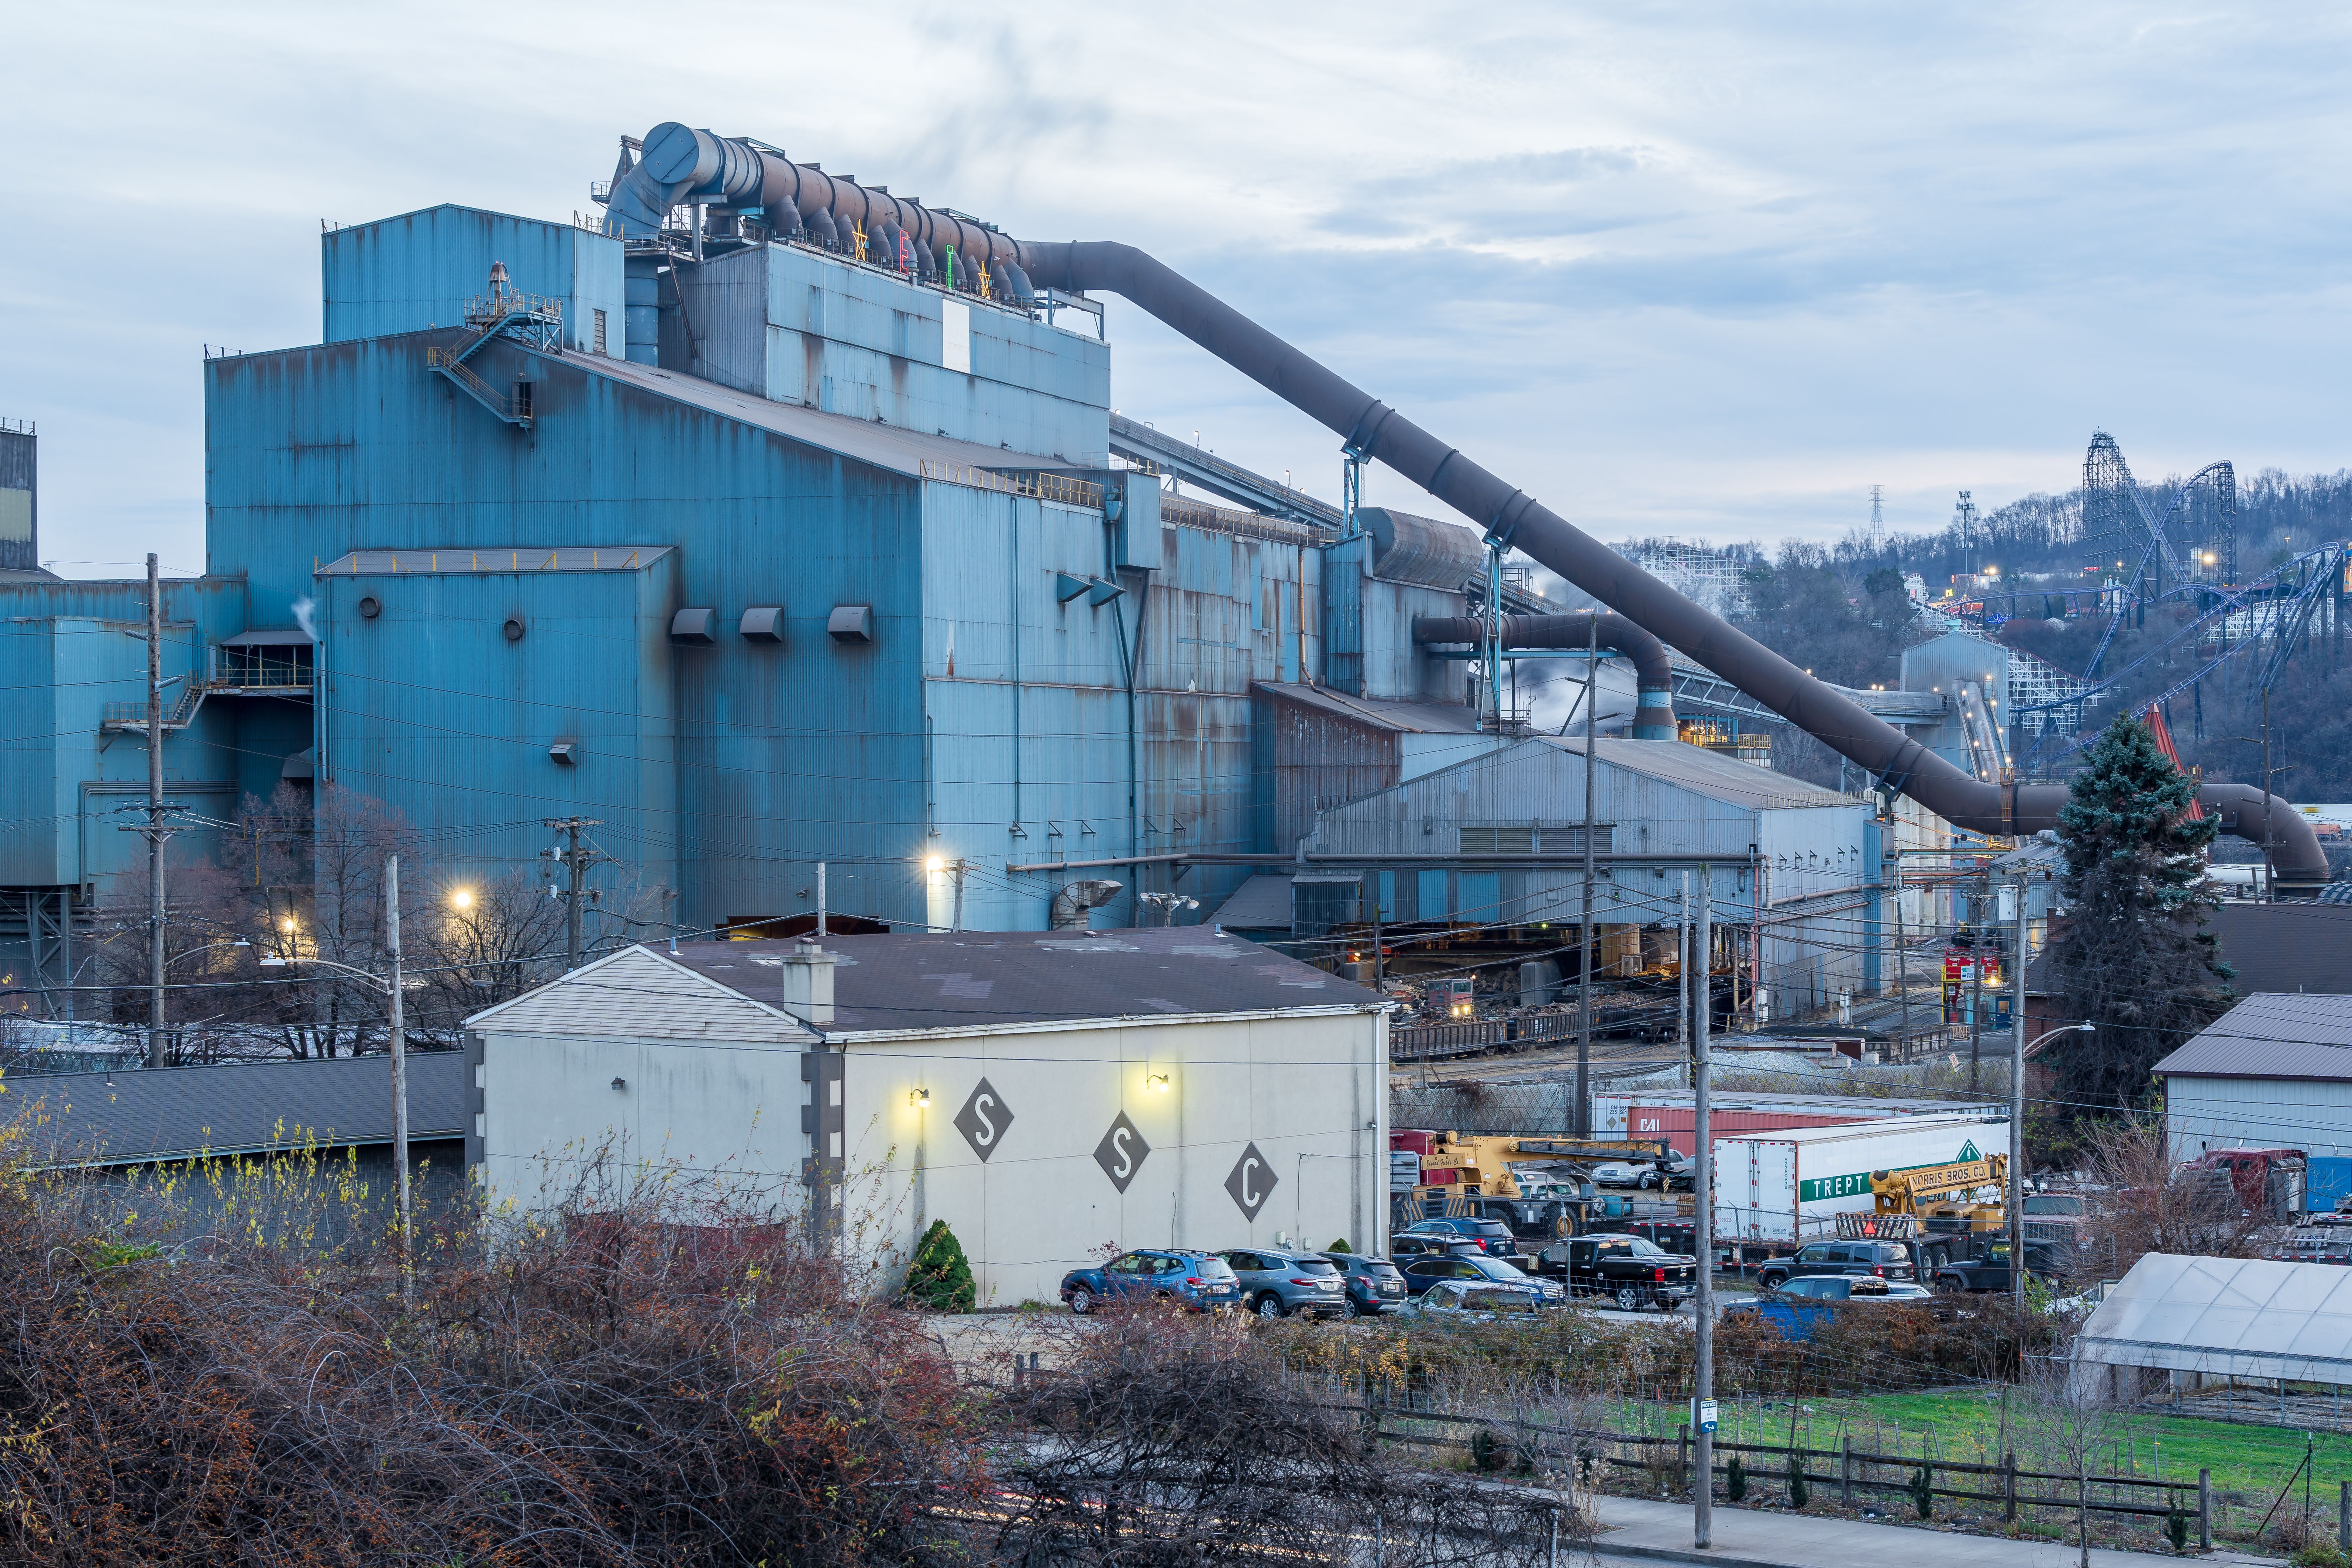
Allegheny County, Pennsylvania
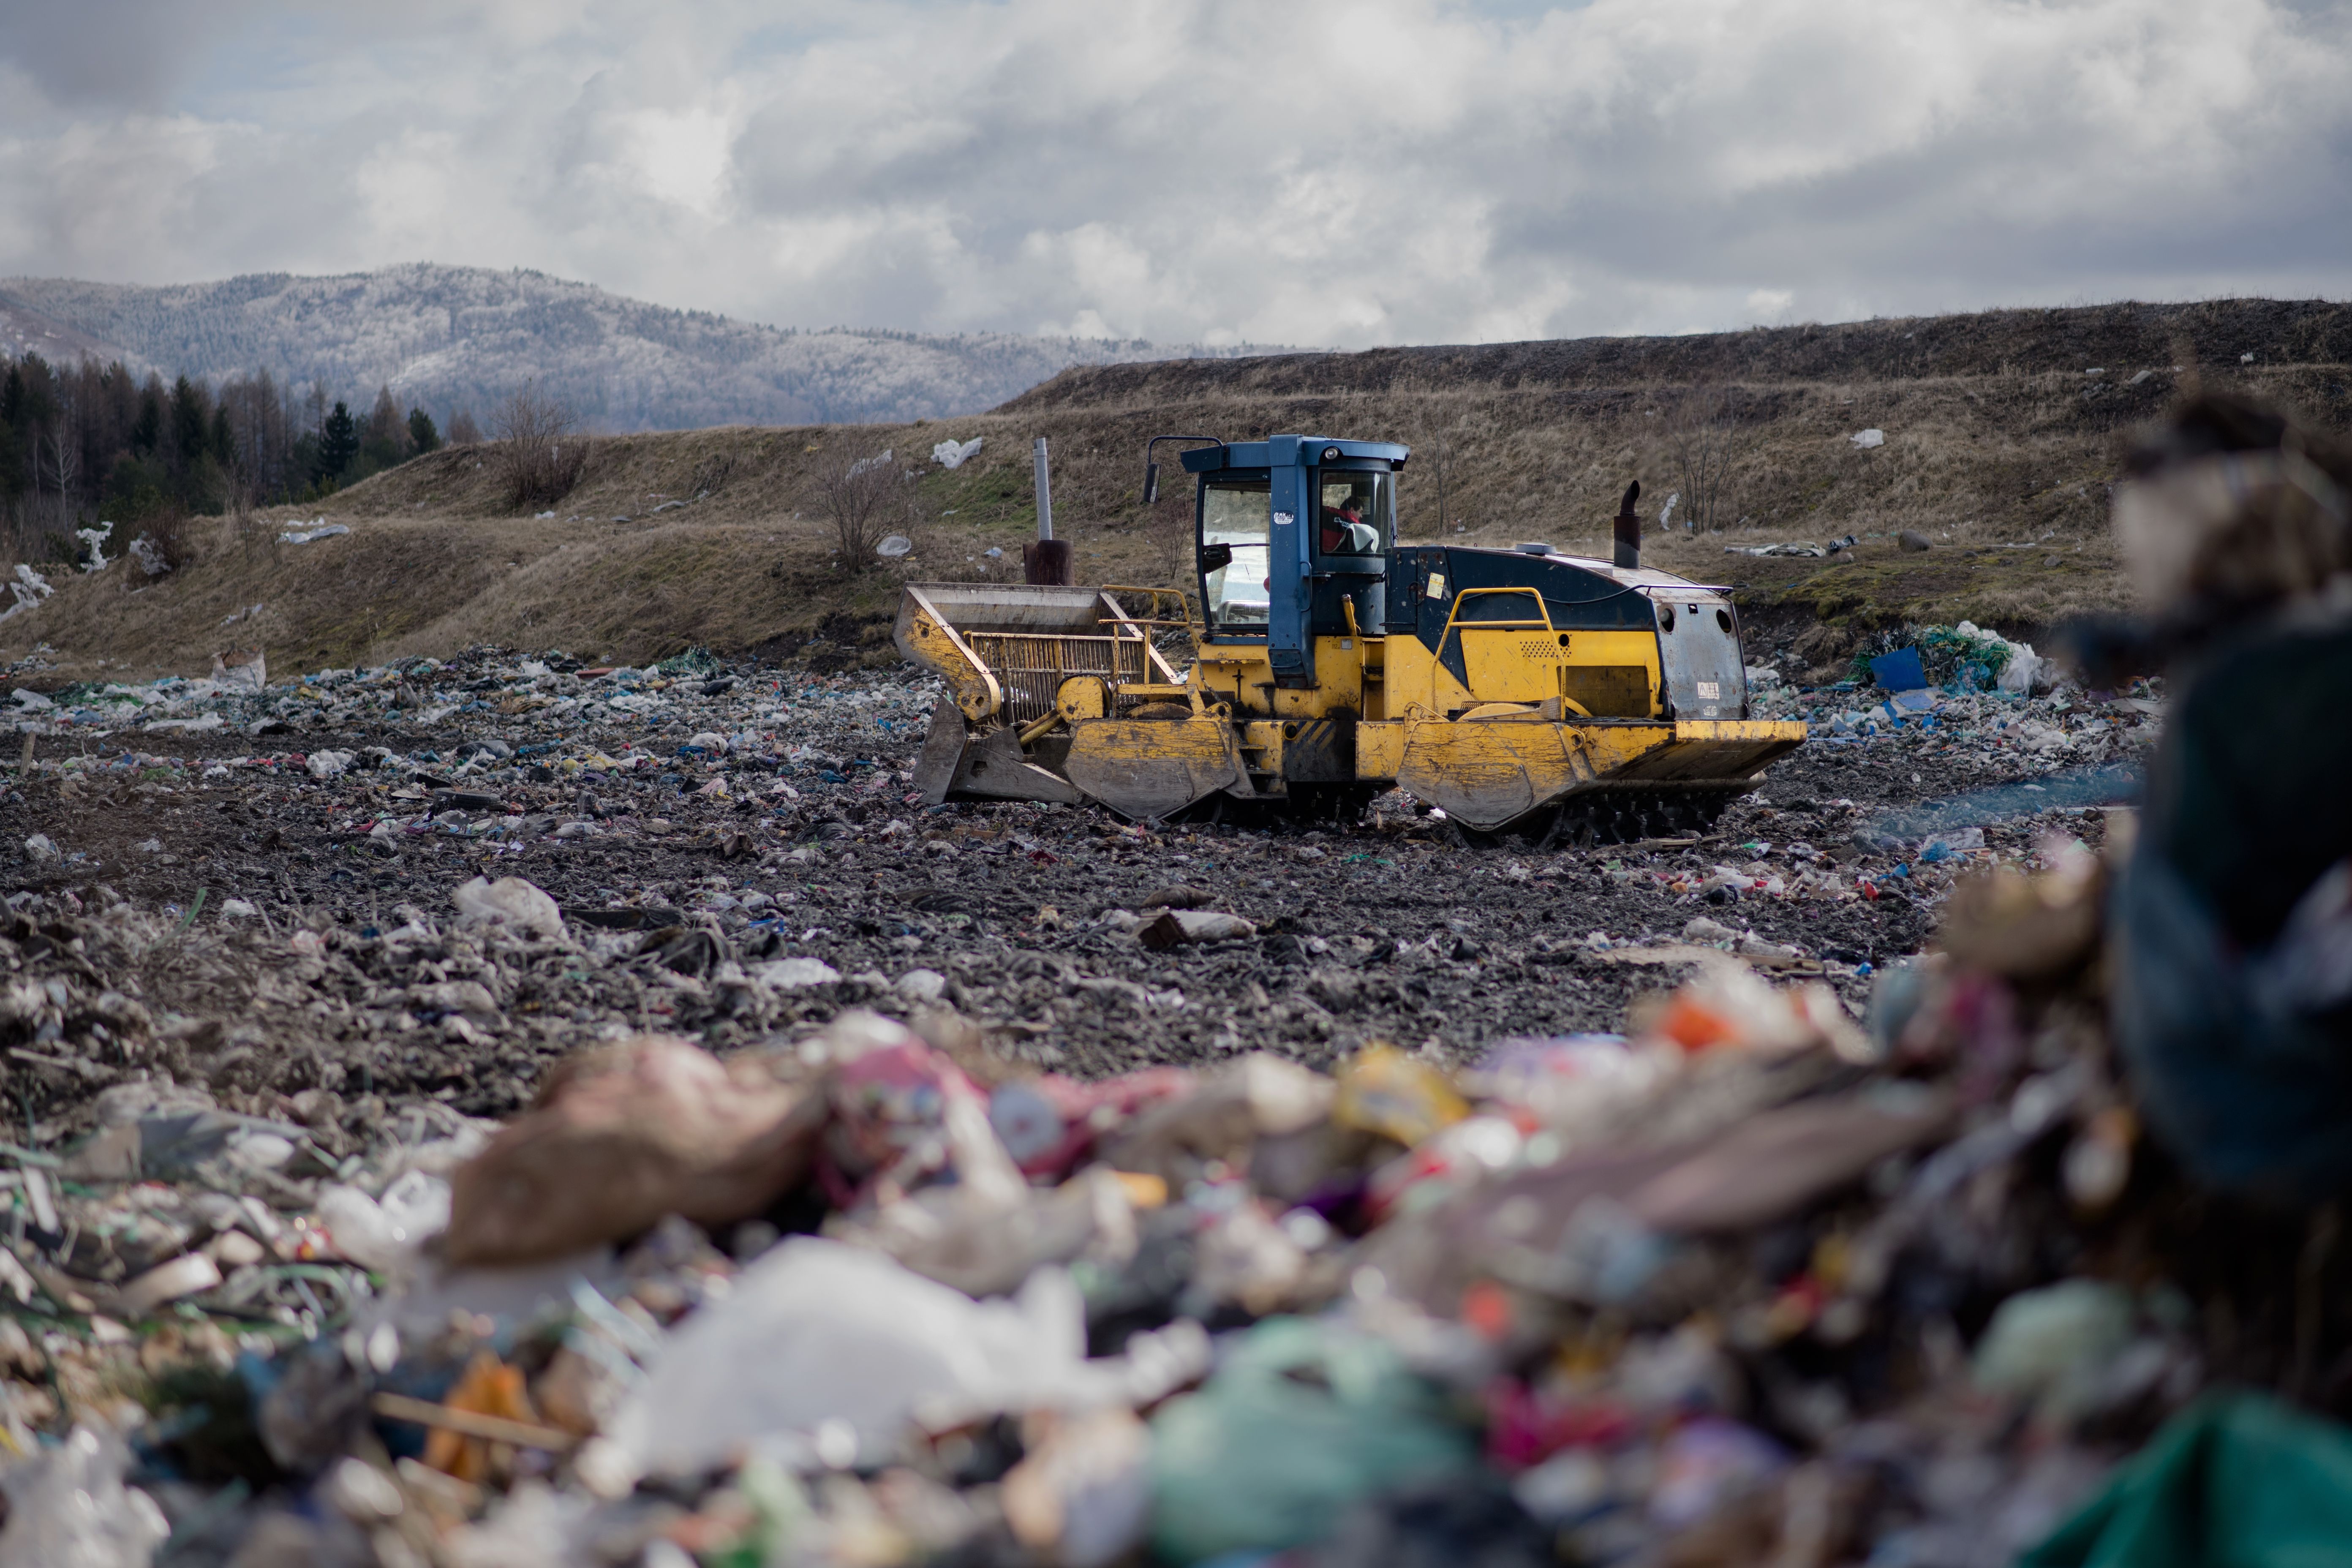
Baltimore County, Maryland
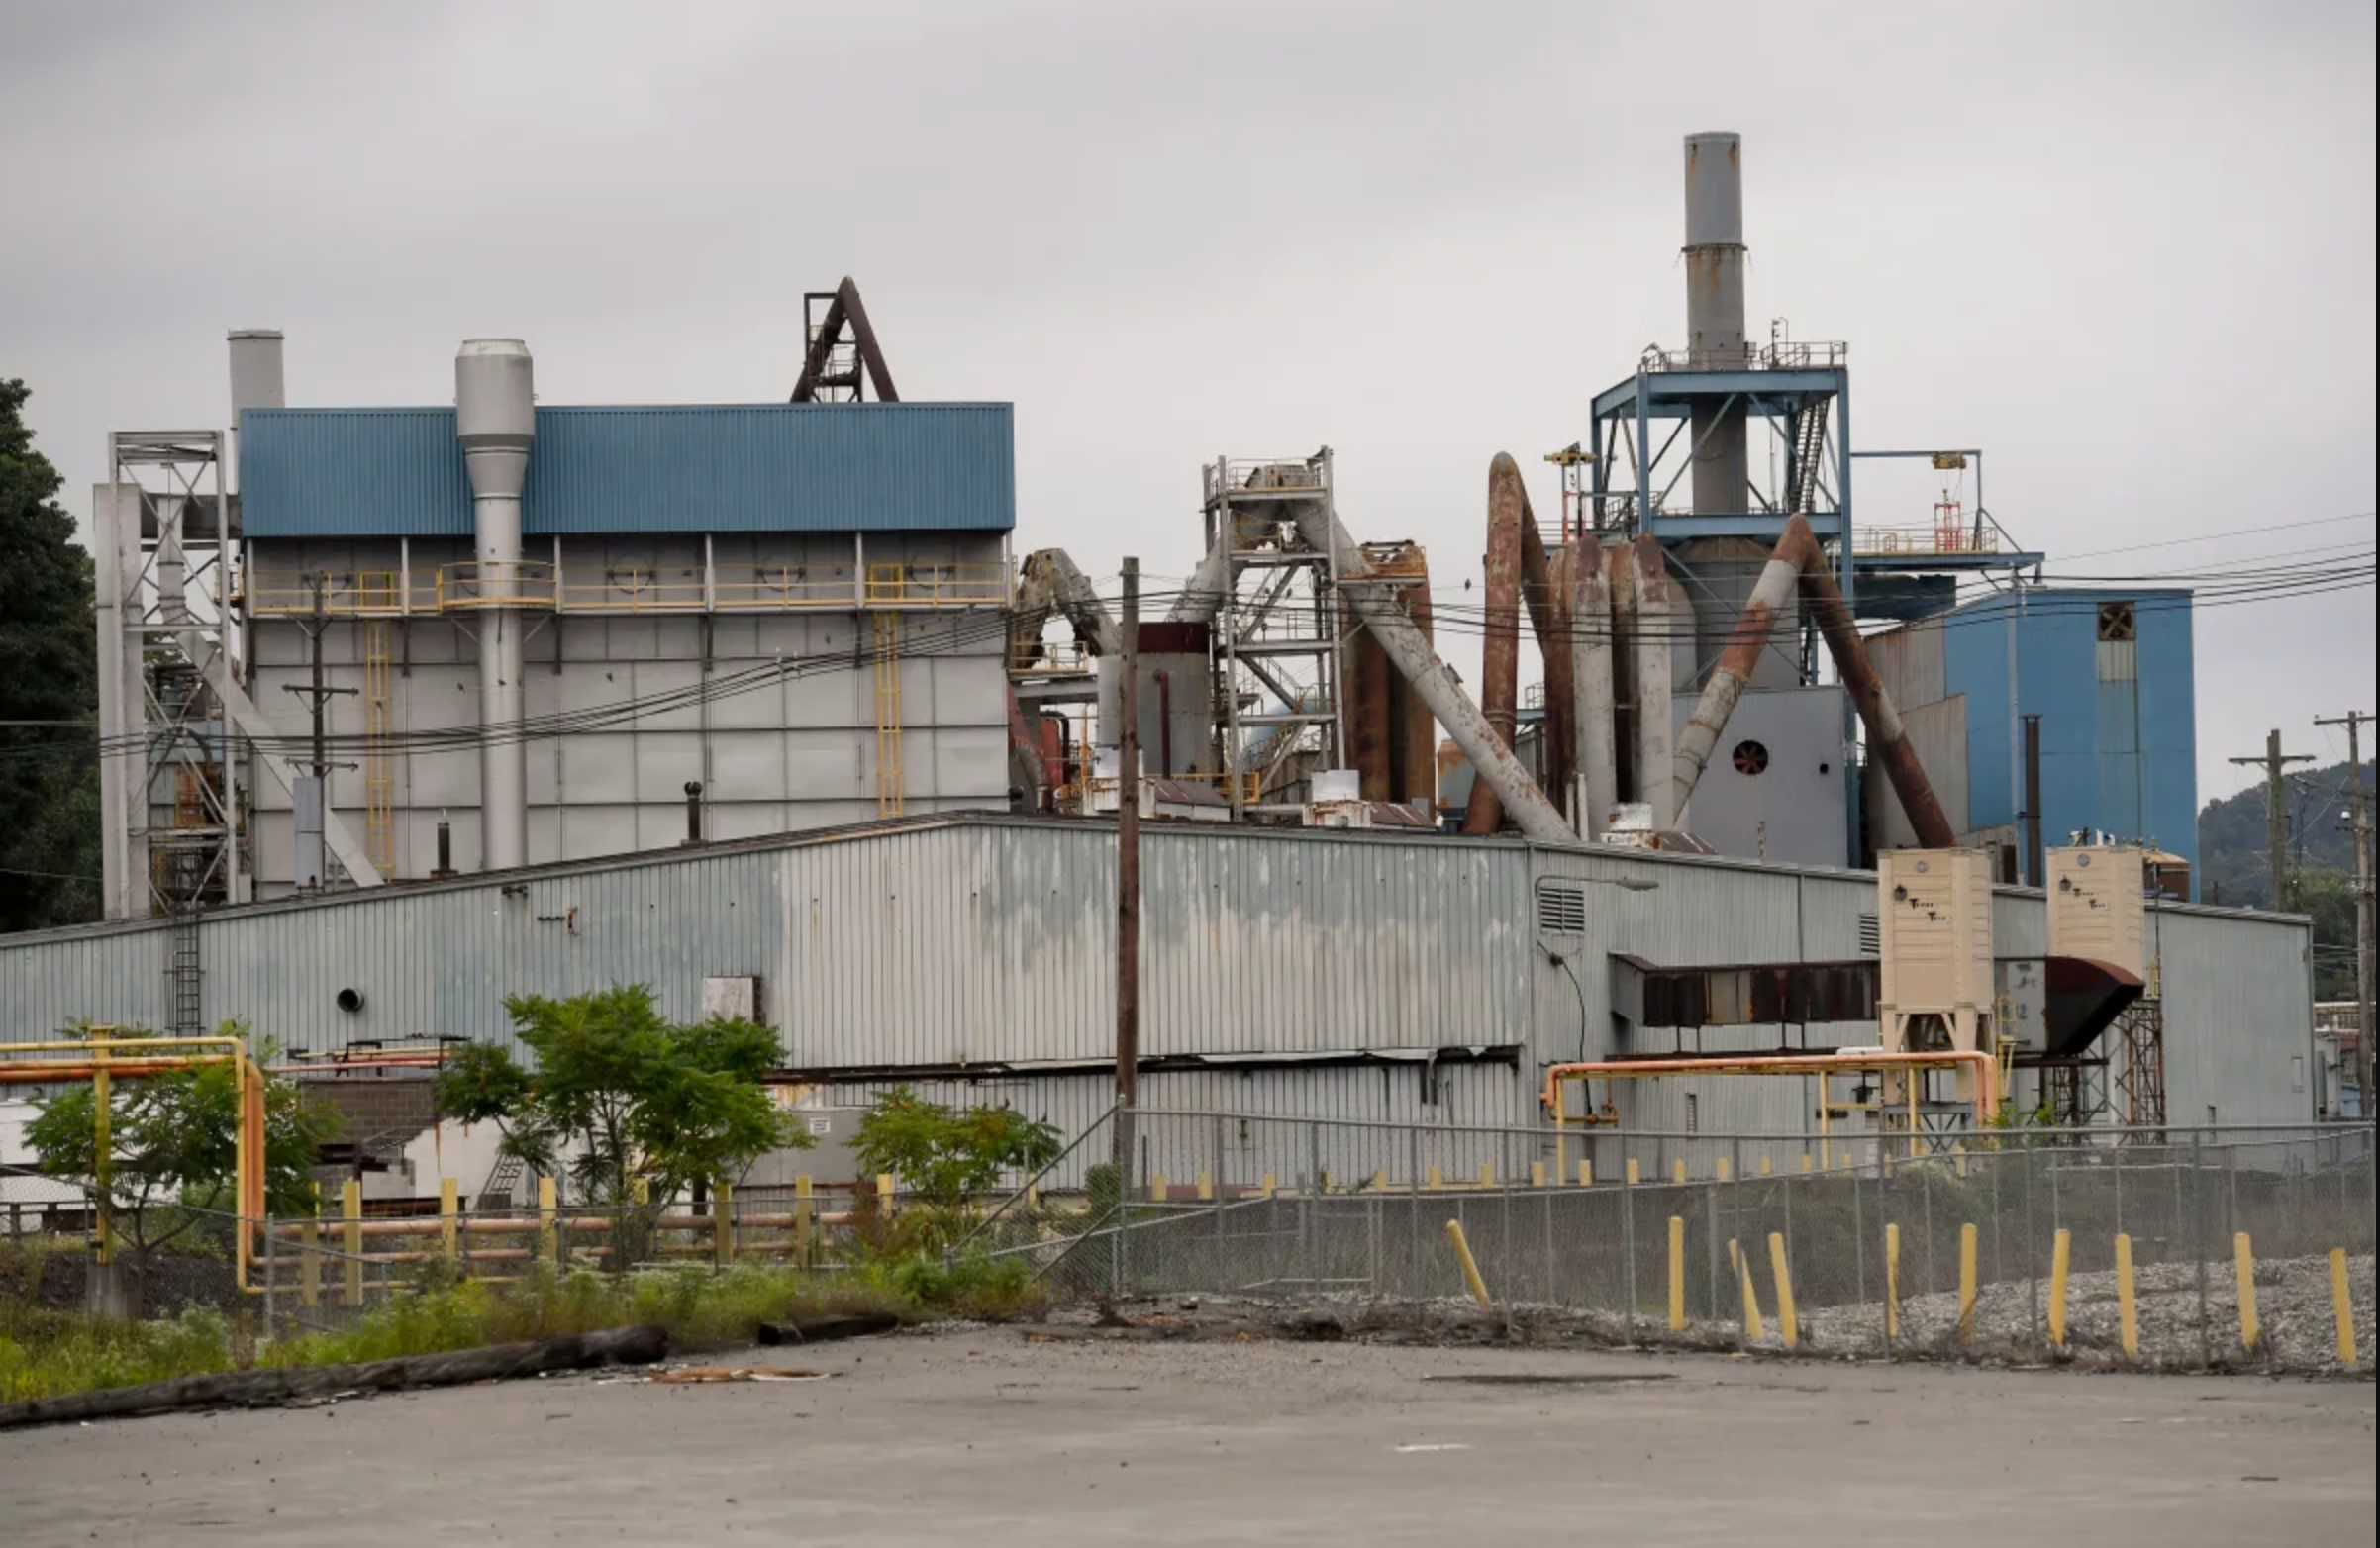
Berks County, Pennsylvania
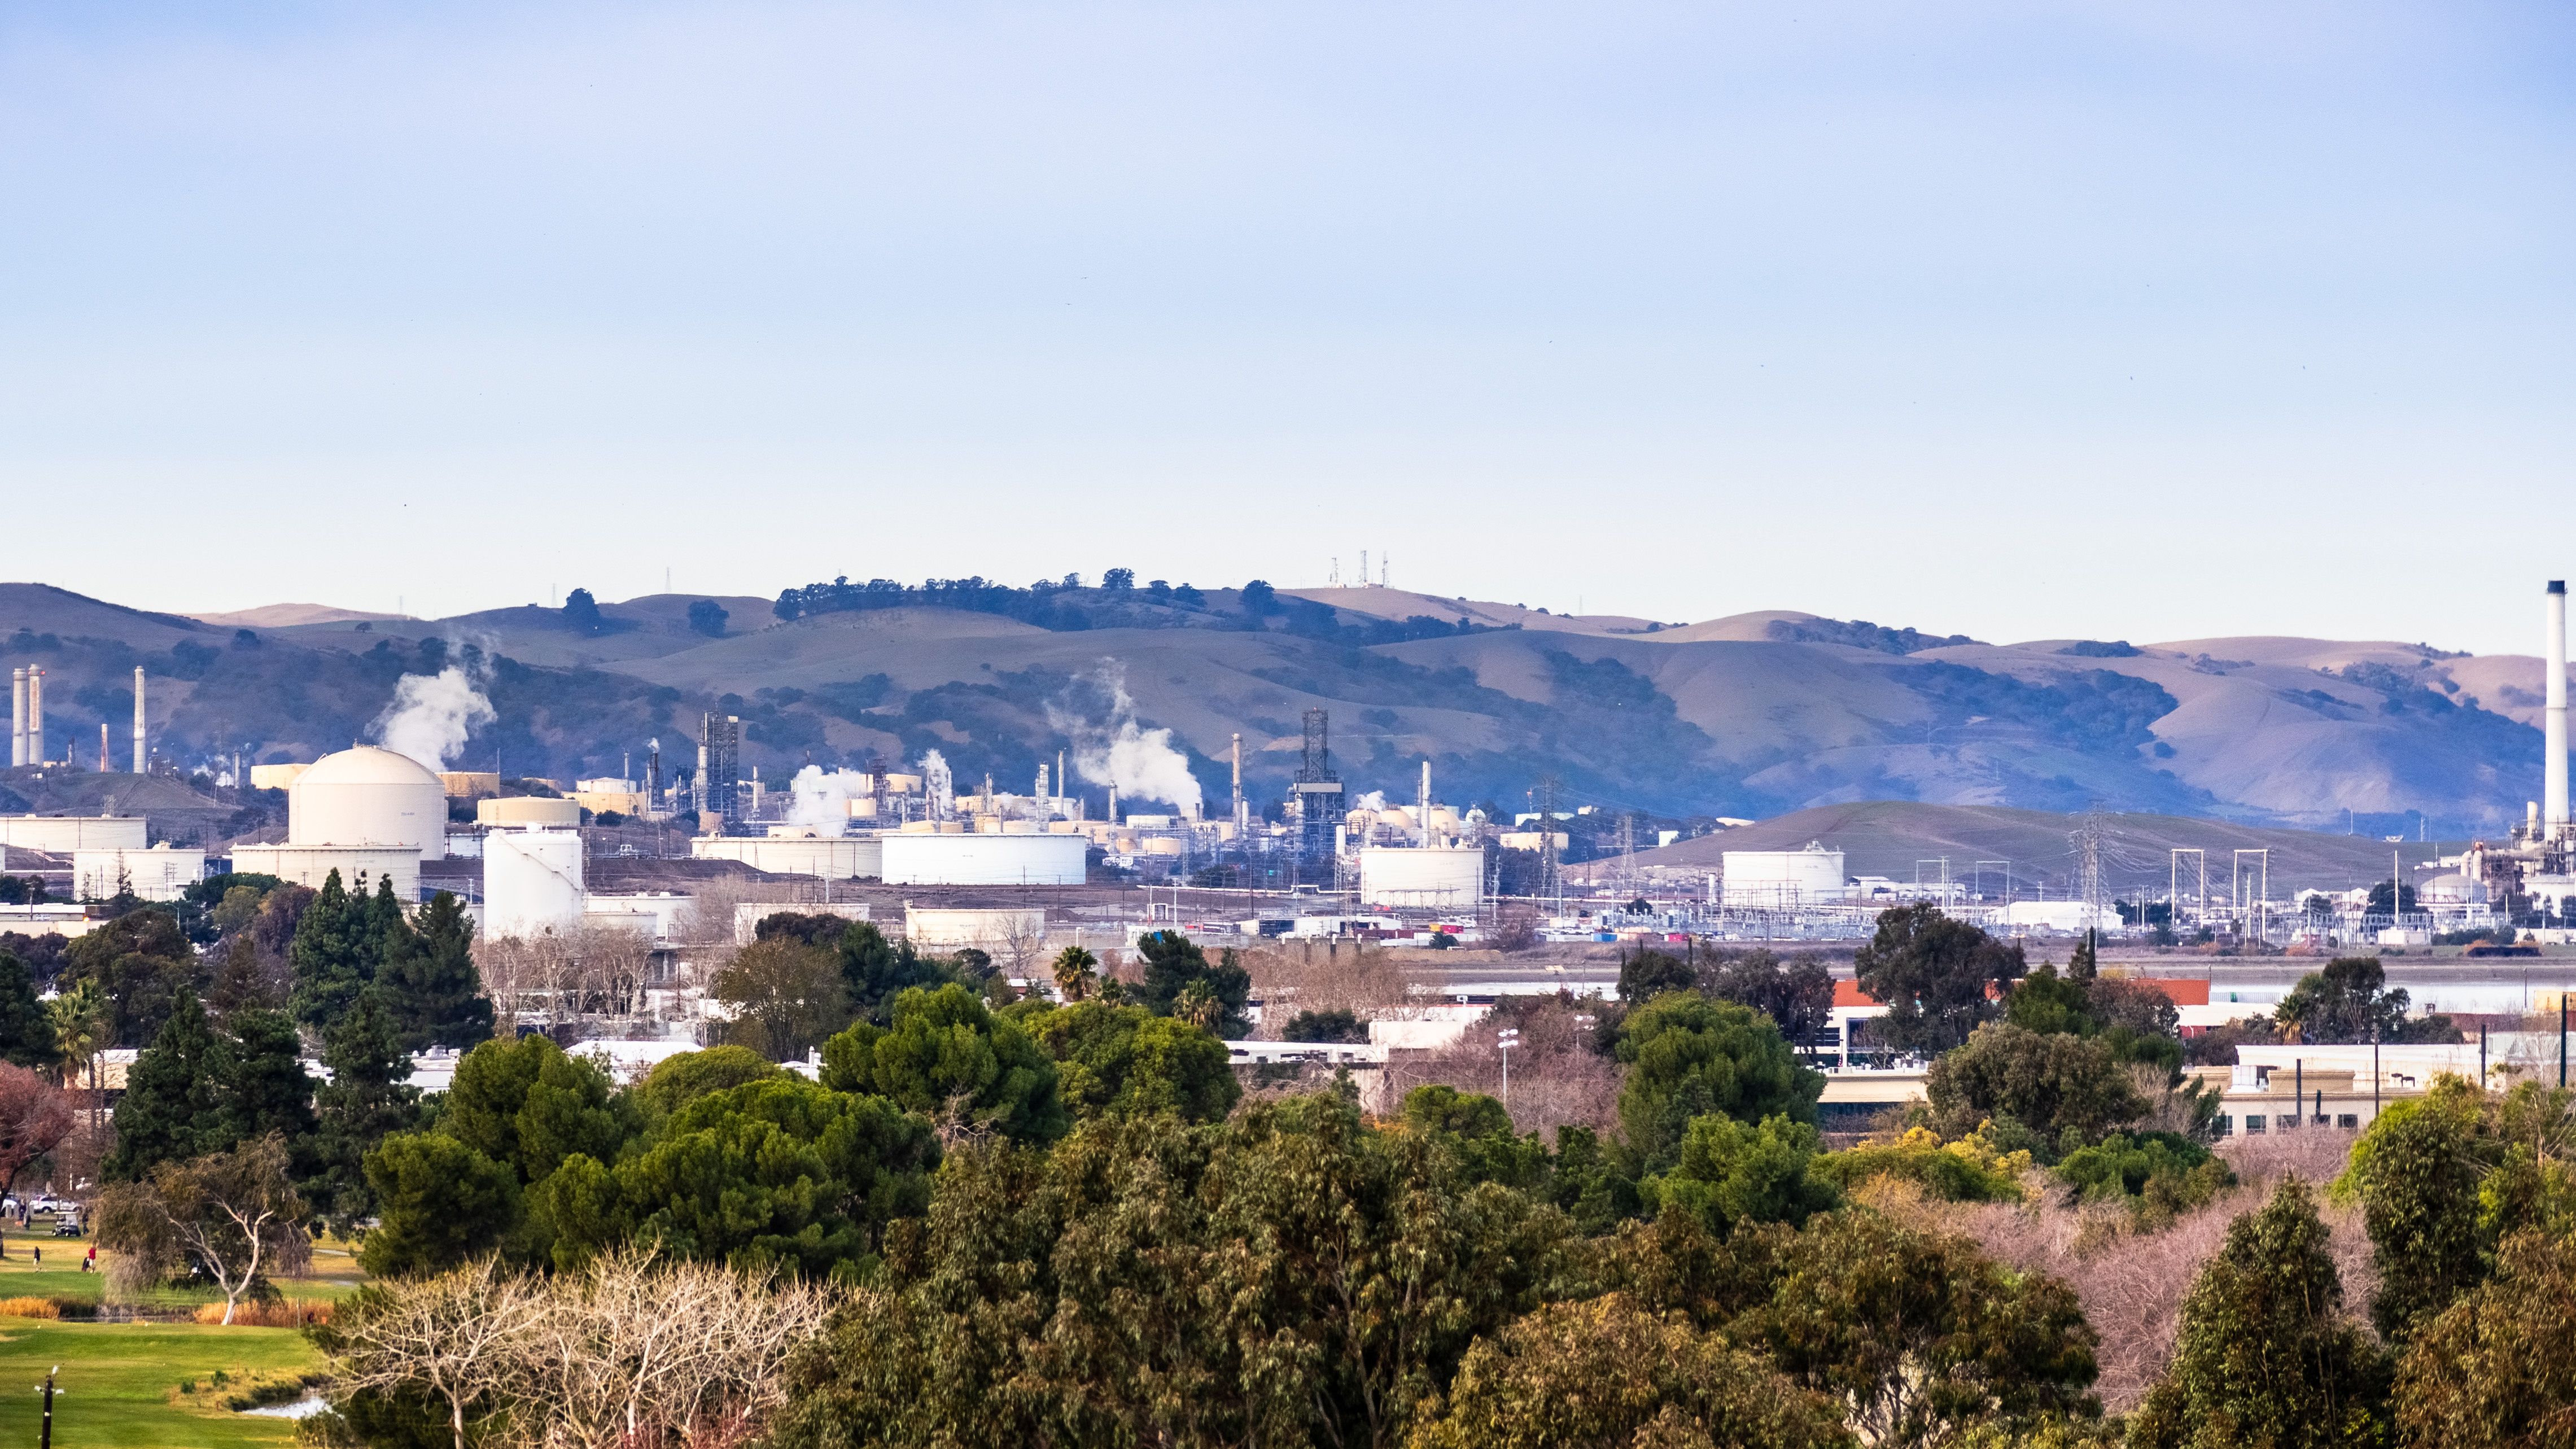
Contra Costa County, California
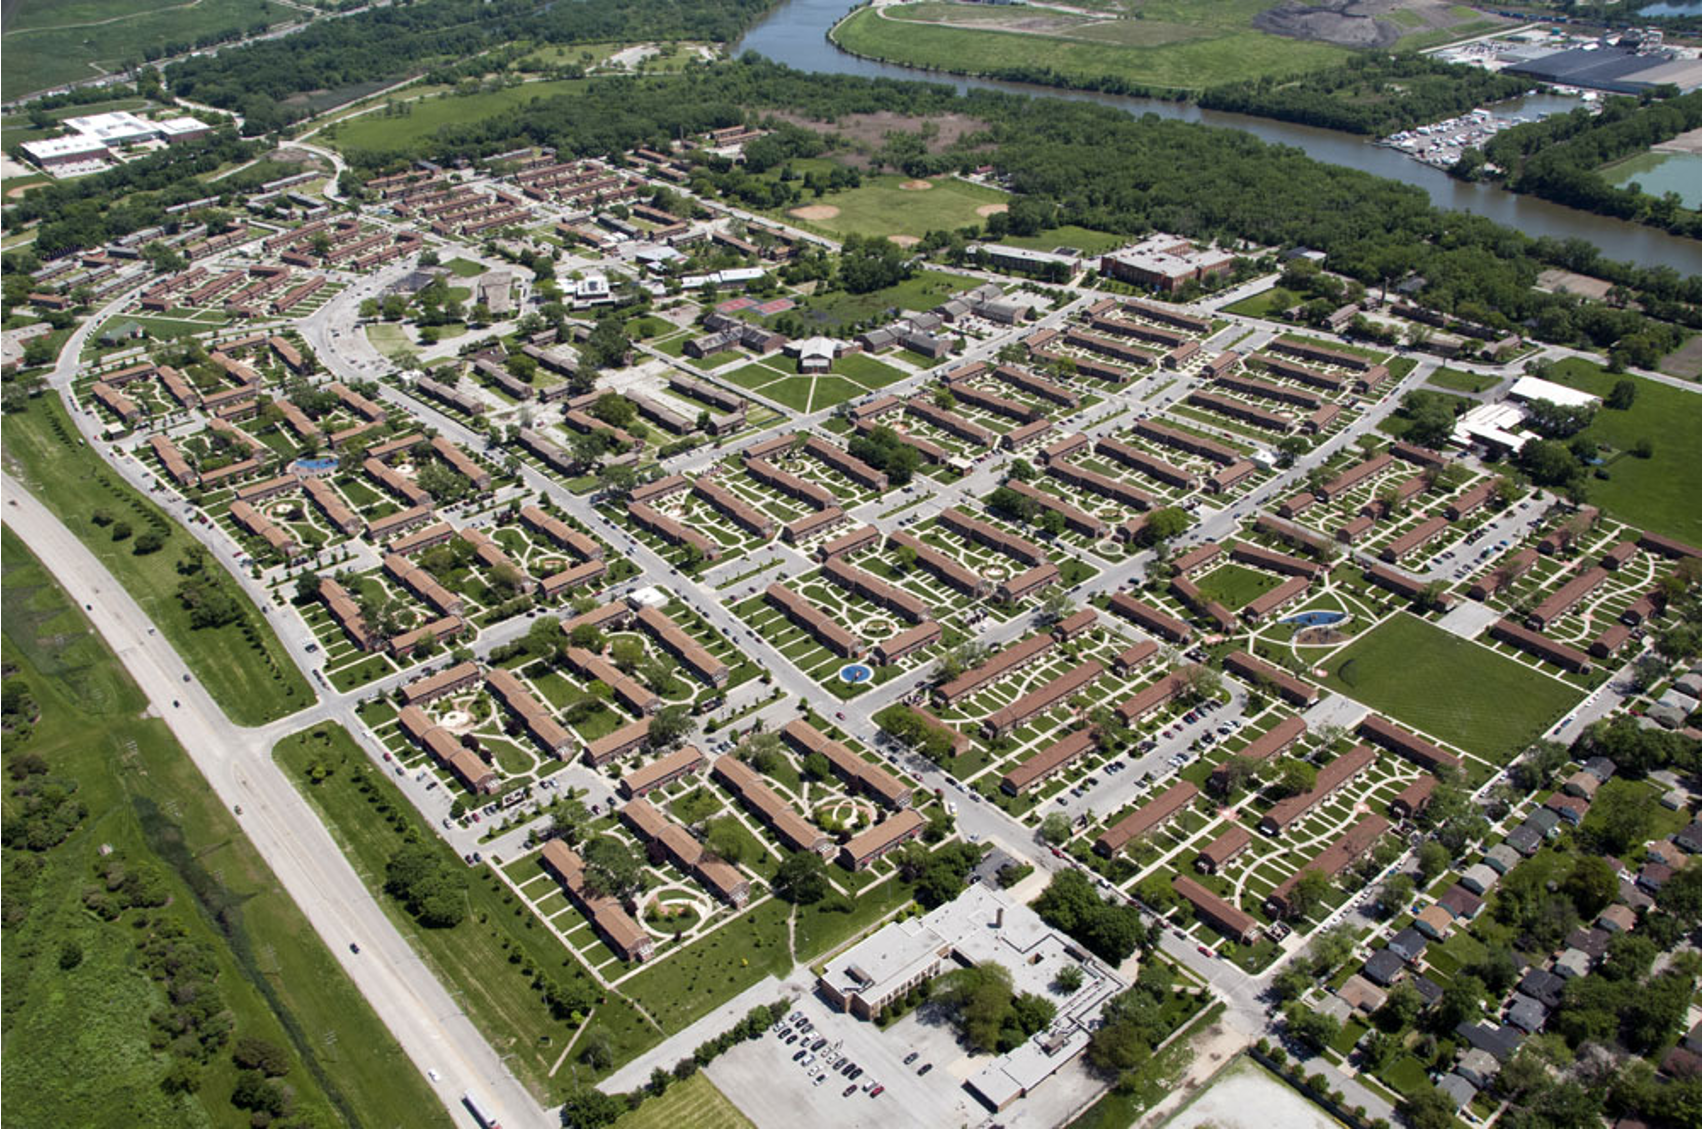
Cook County, Illinois
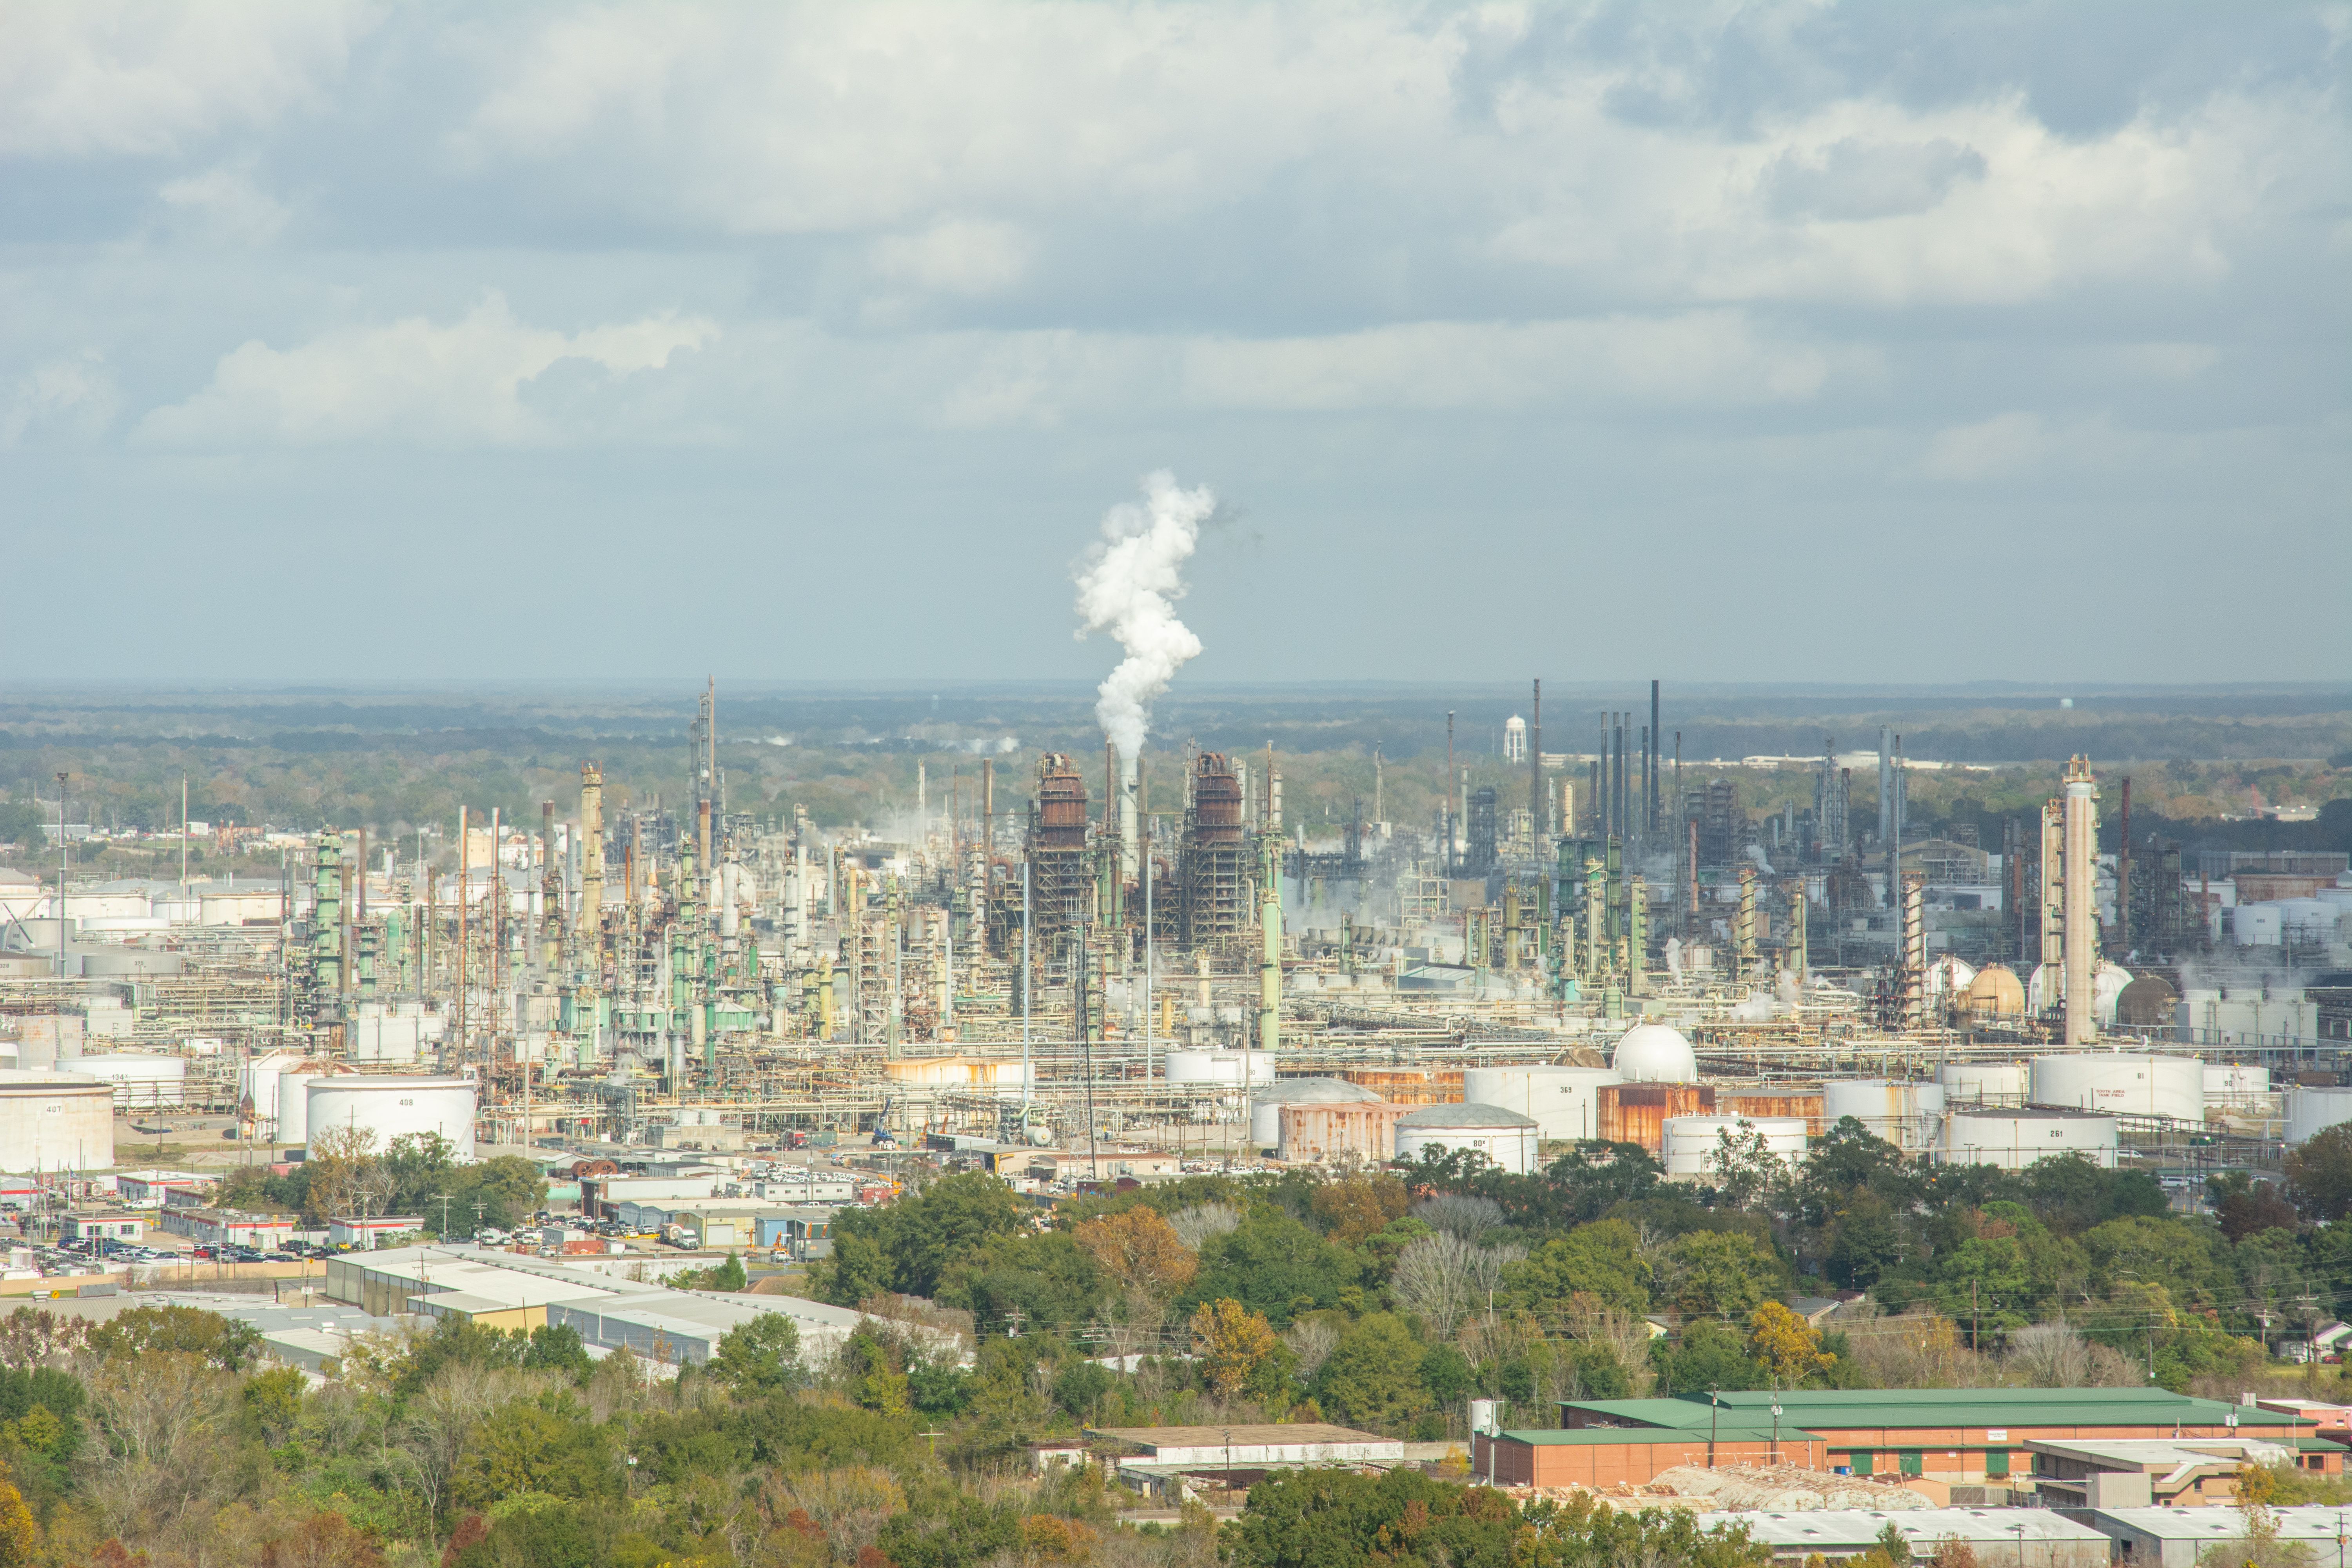
East Baton Rouge Region (Cancer Alley)
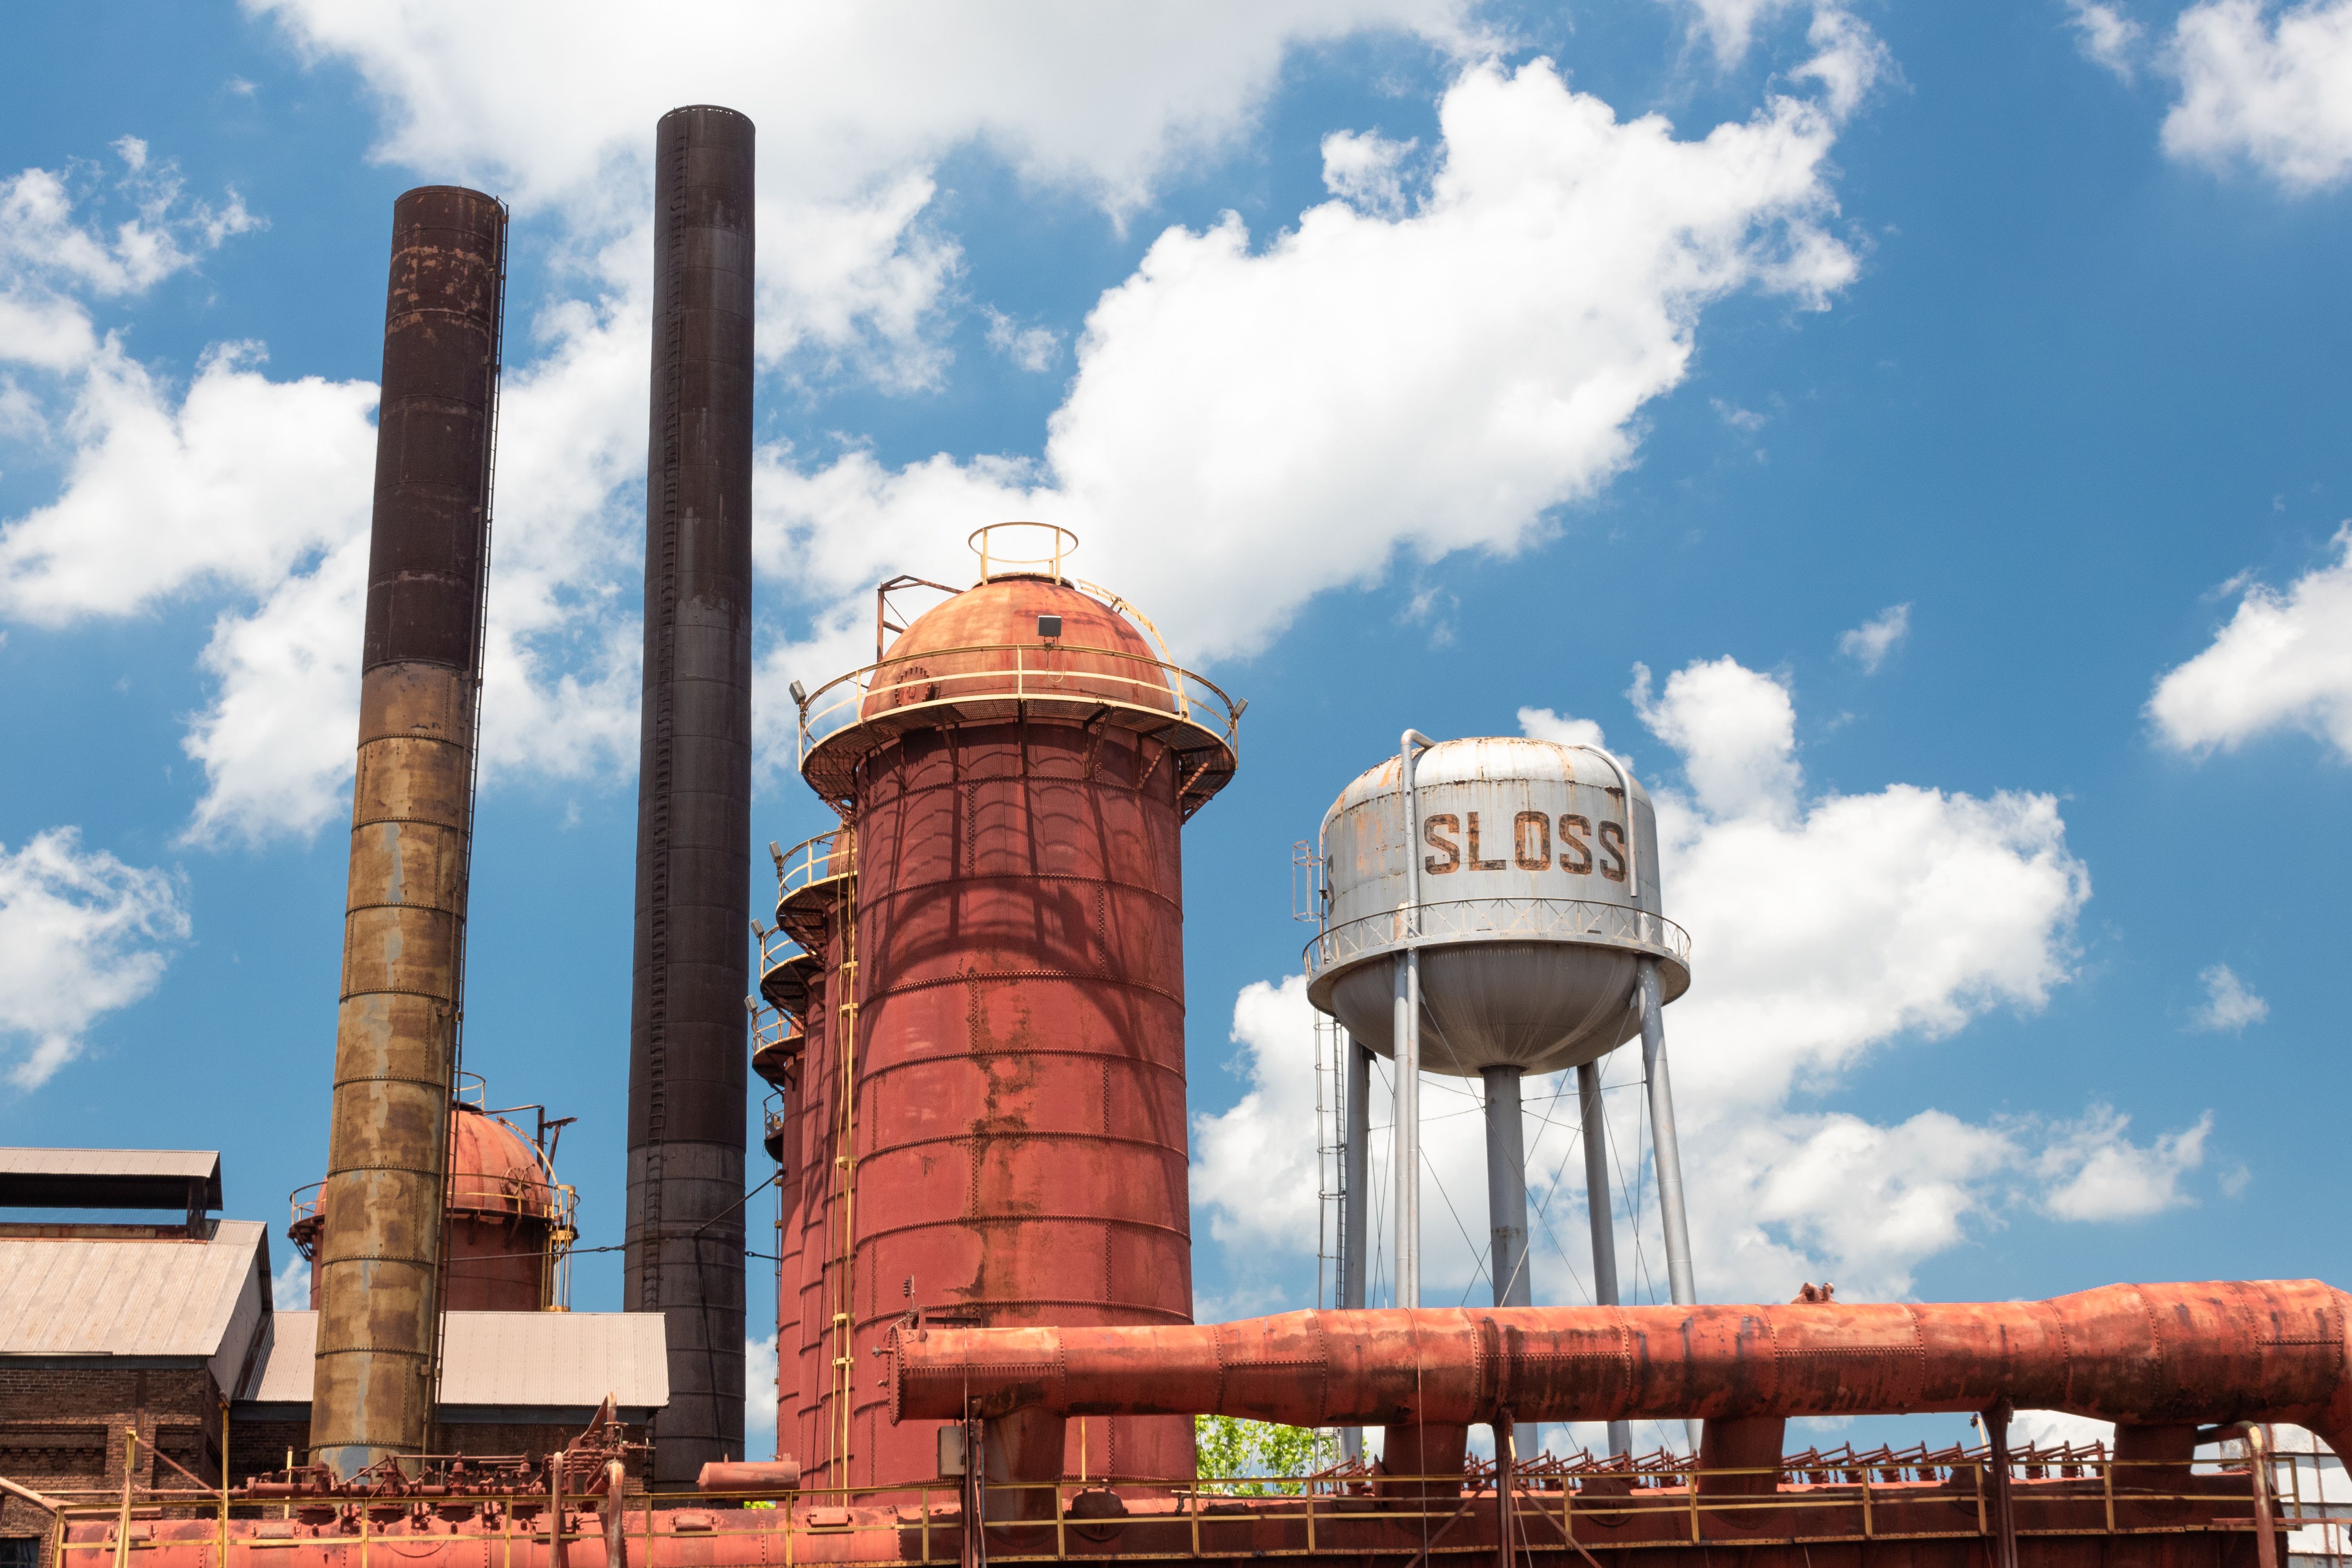
Greater Birmingham, Alabama
Greater Detroit Area, Michigan
Harris County, Texas
Lake County, Indiana

Lower Ohio River Valley Region
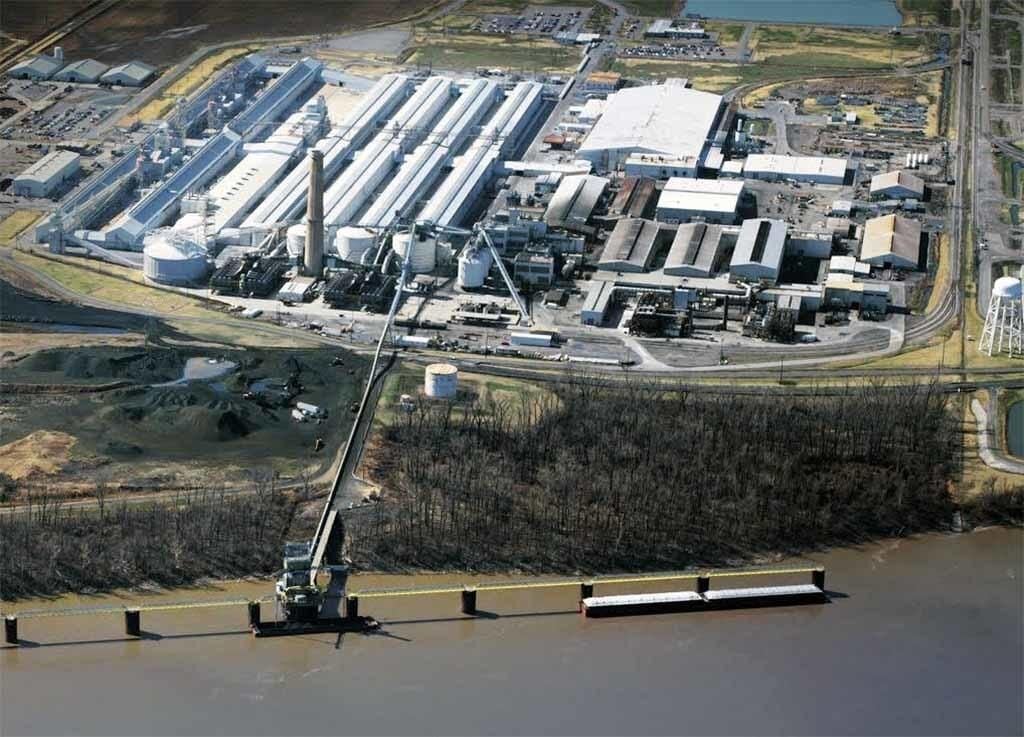
New Madrid, Missouri
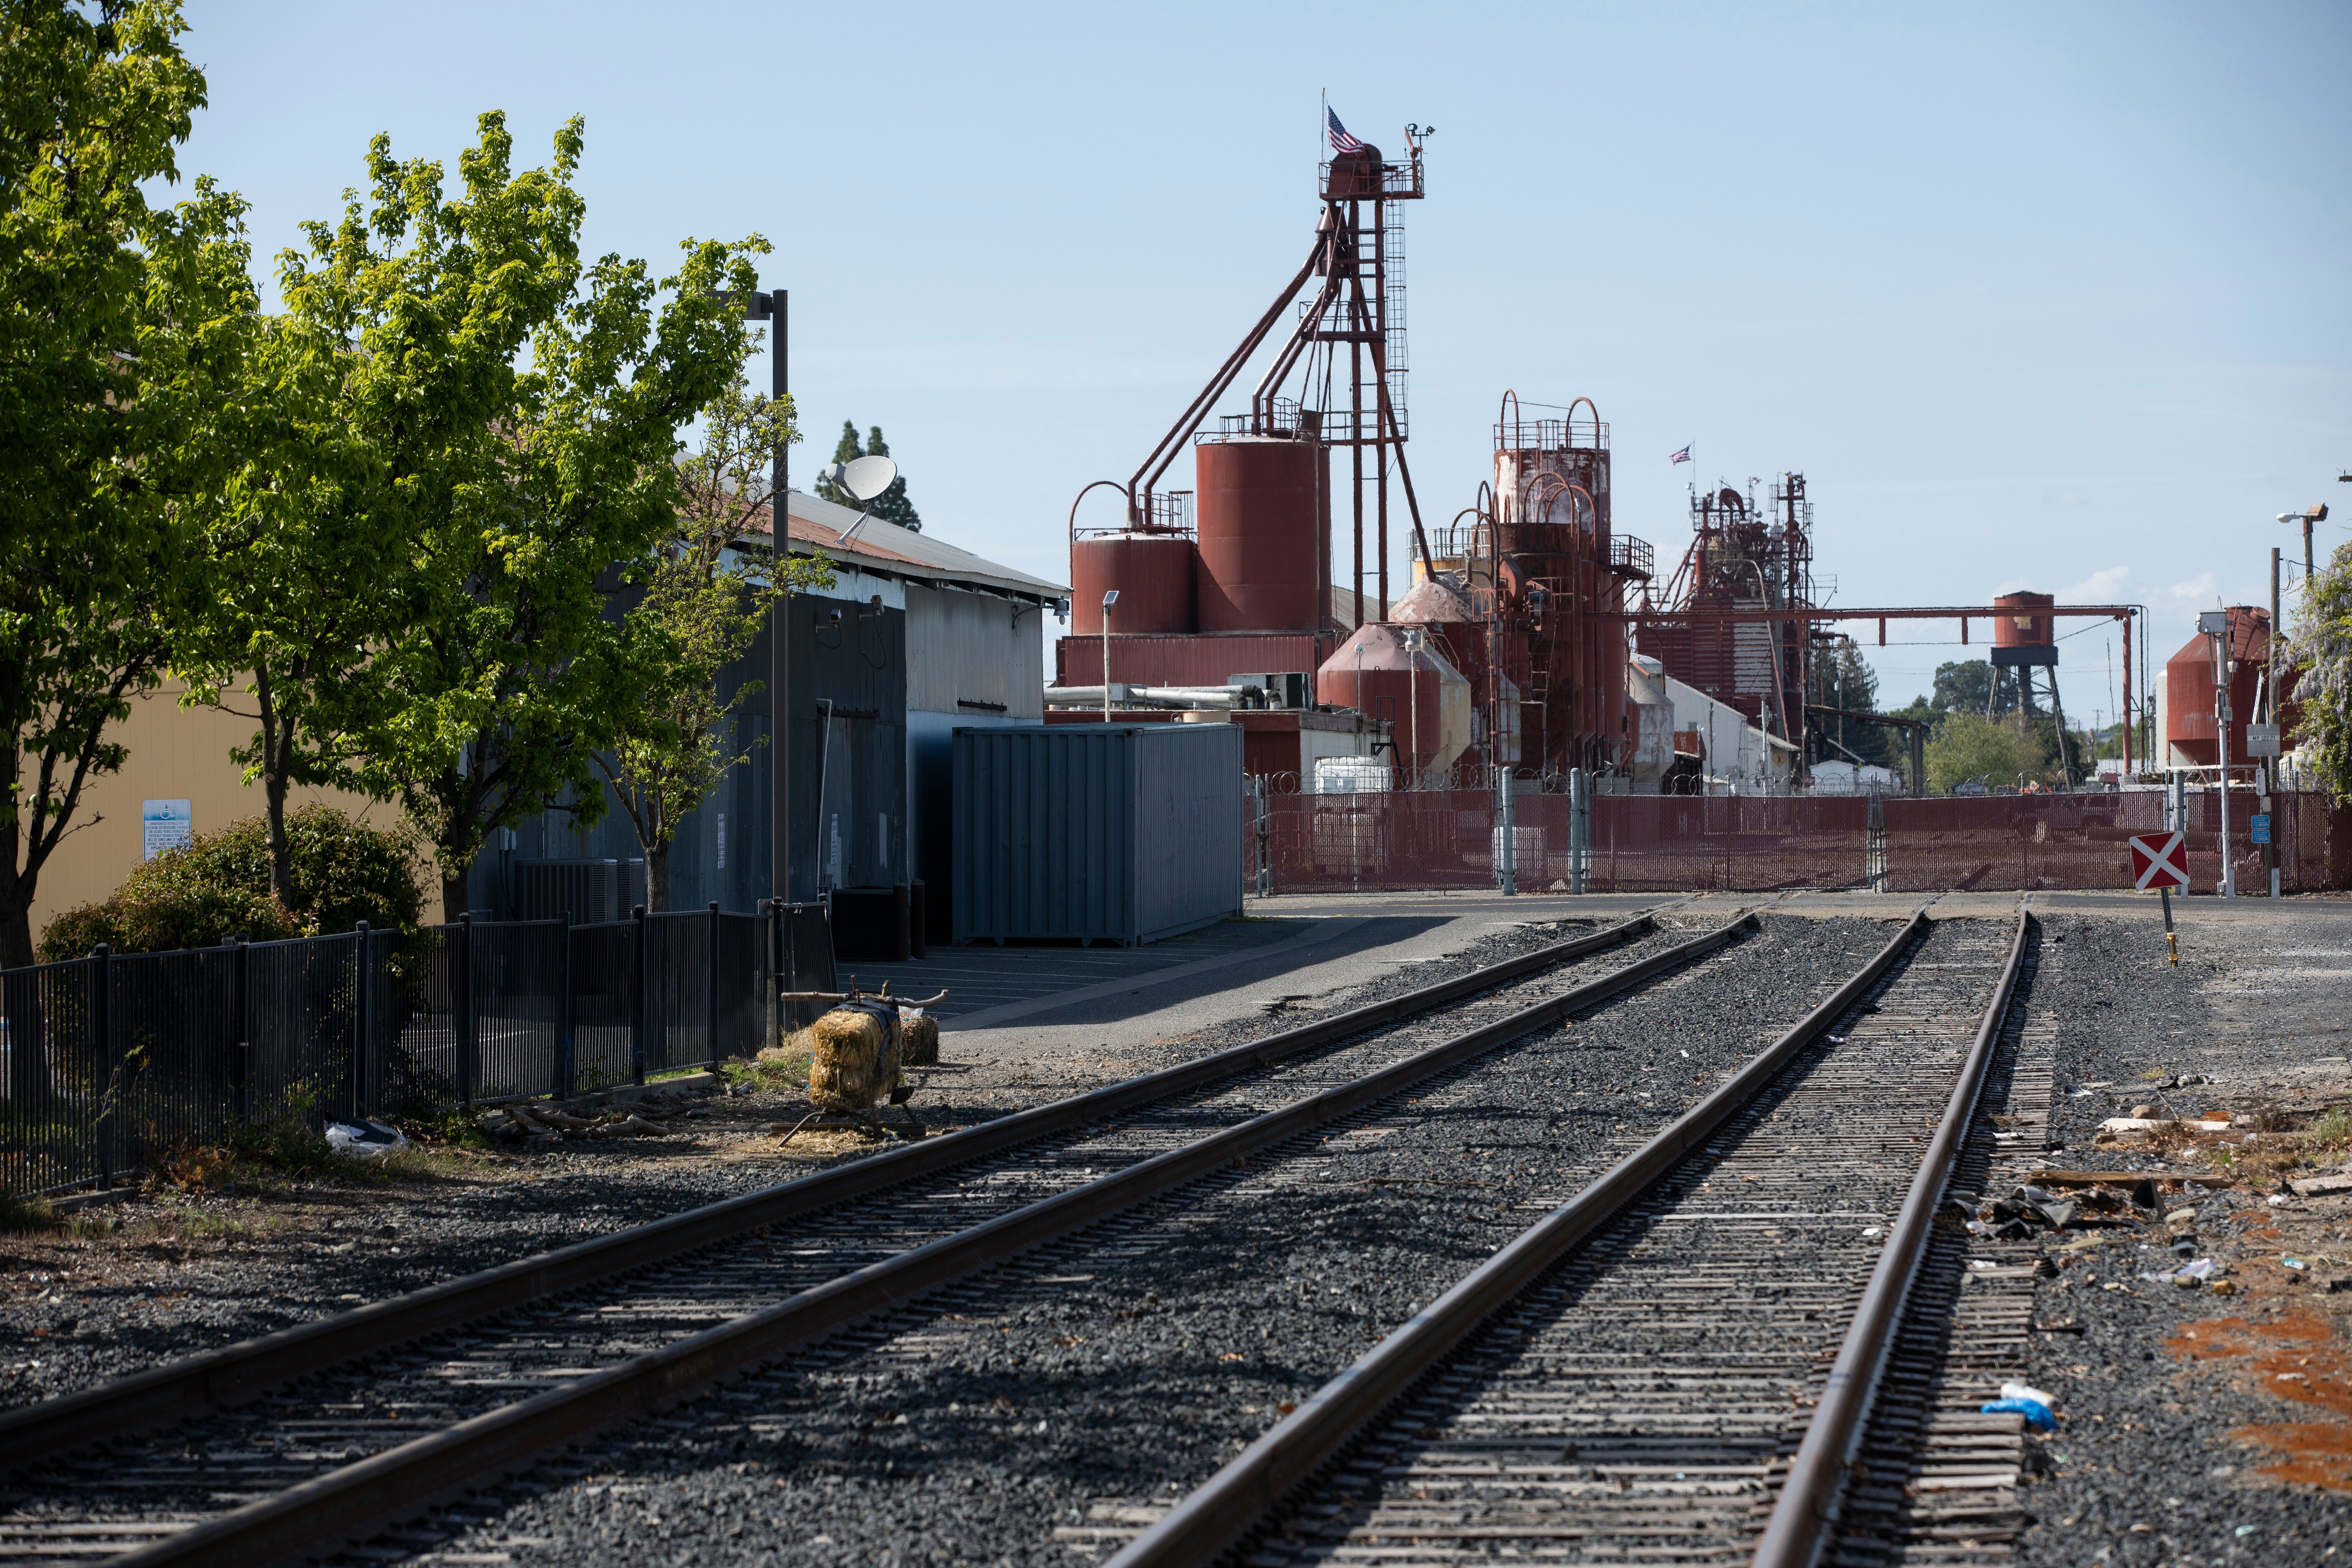
San Joaquin Valley, California
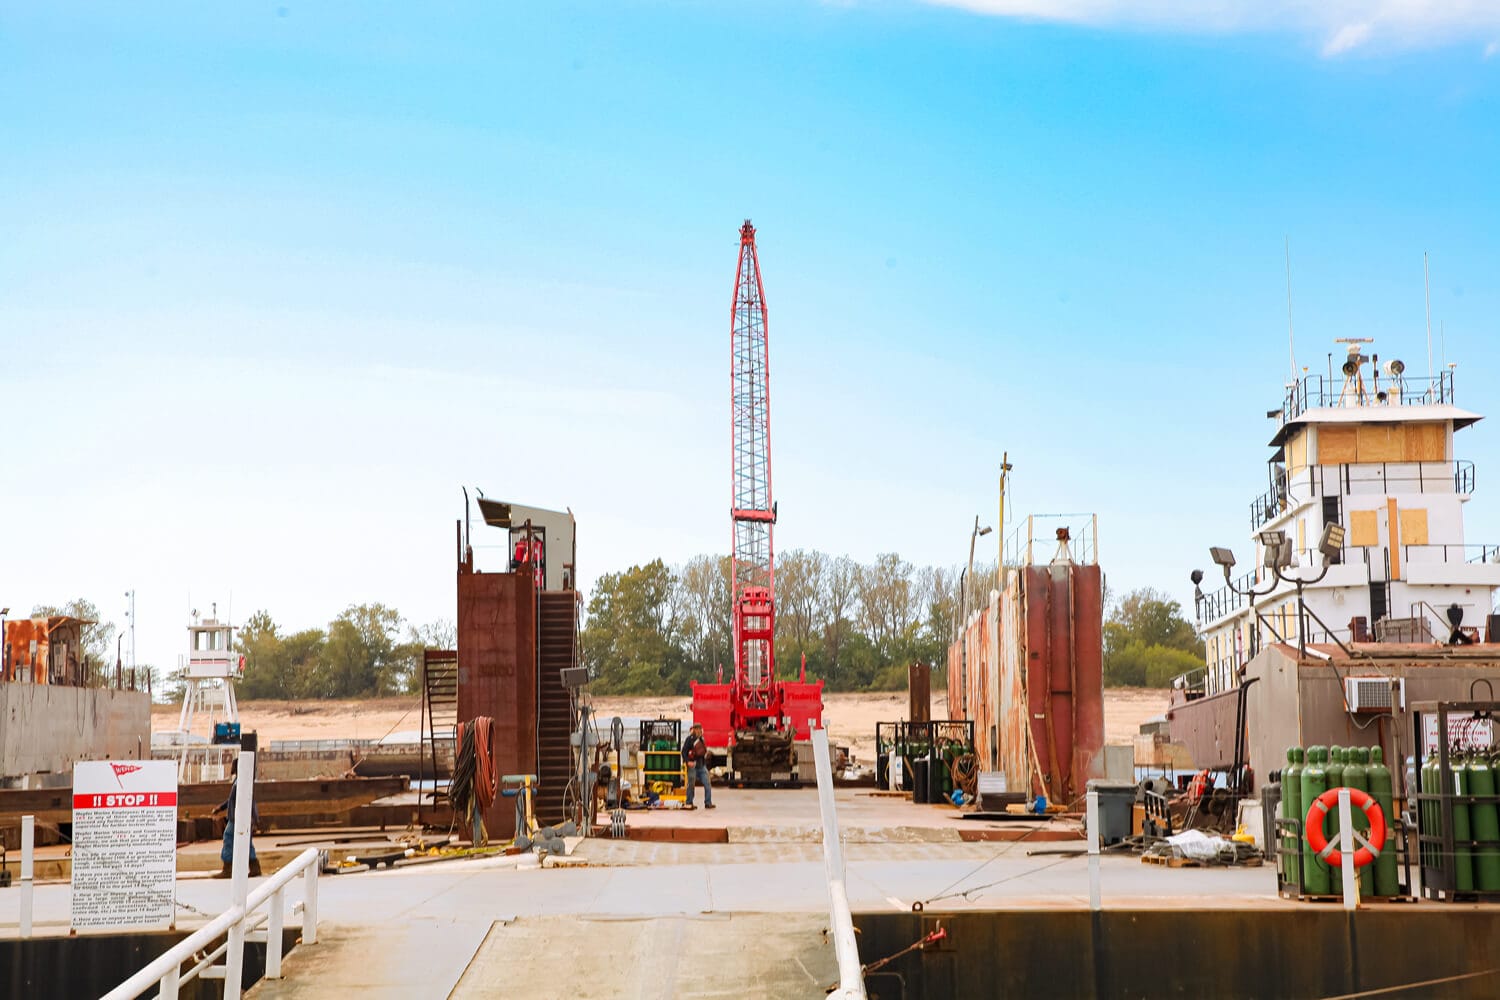
Shelby County, Tennessee
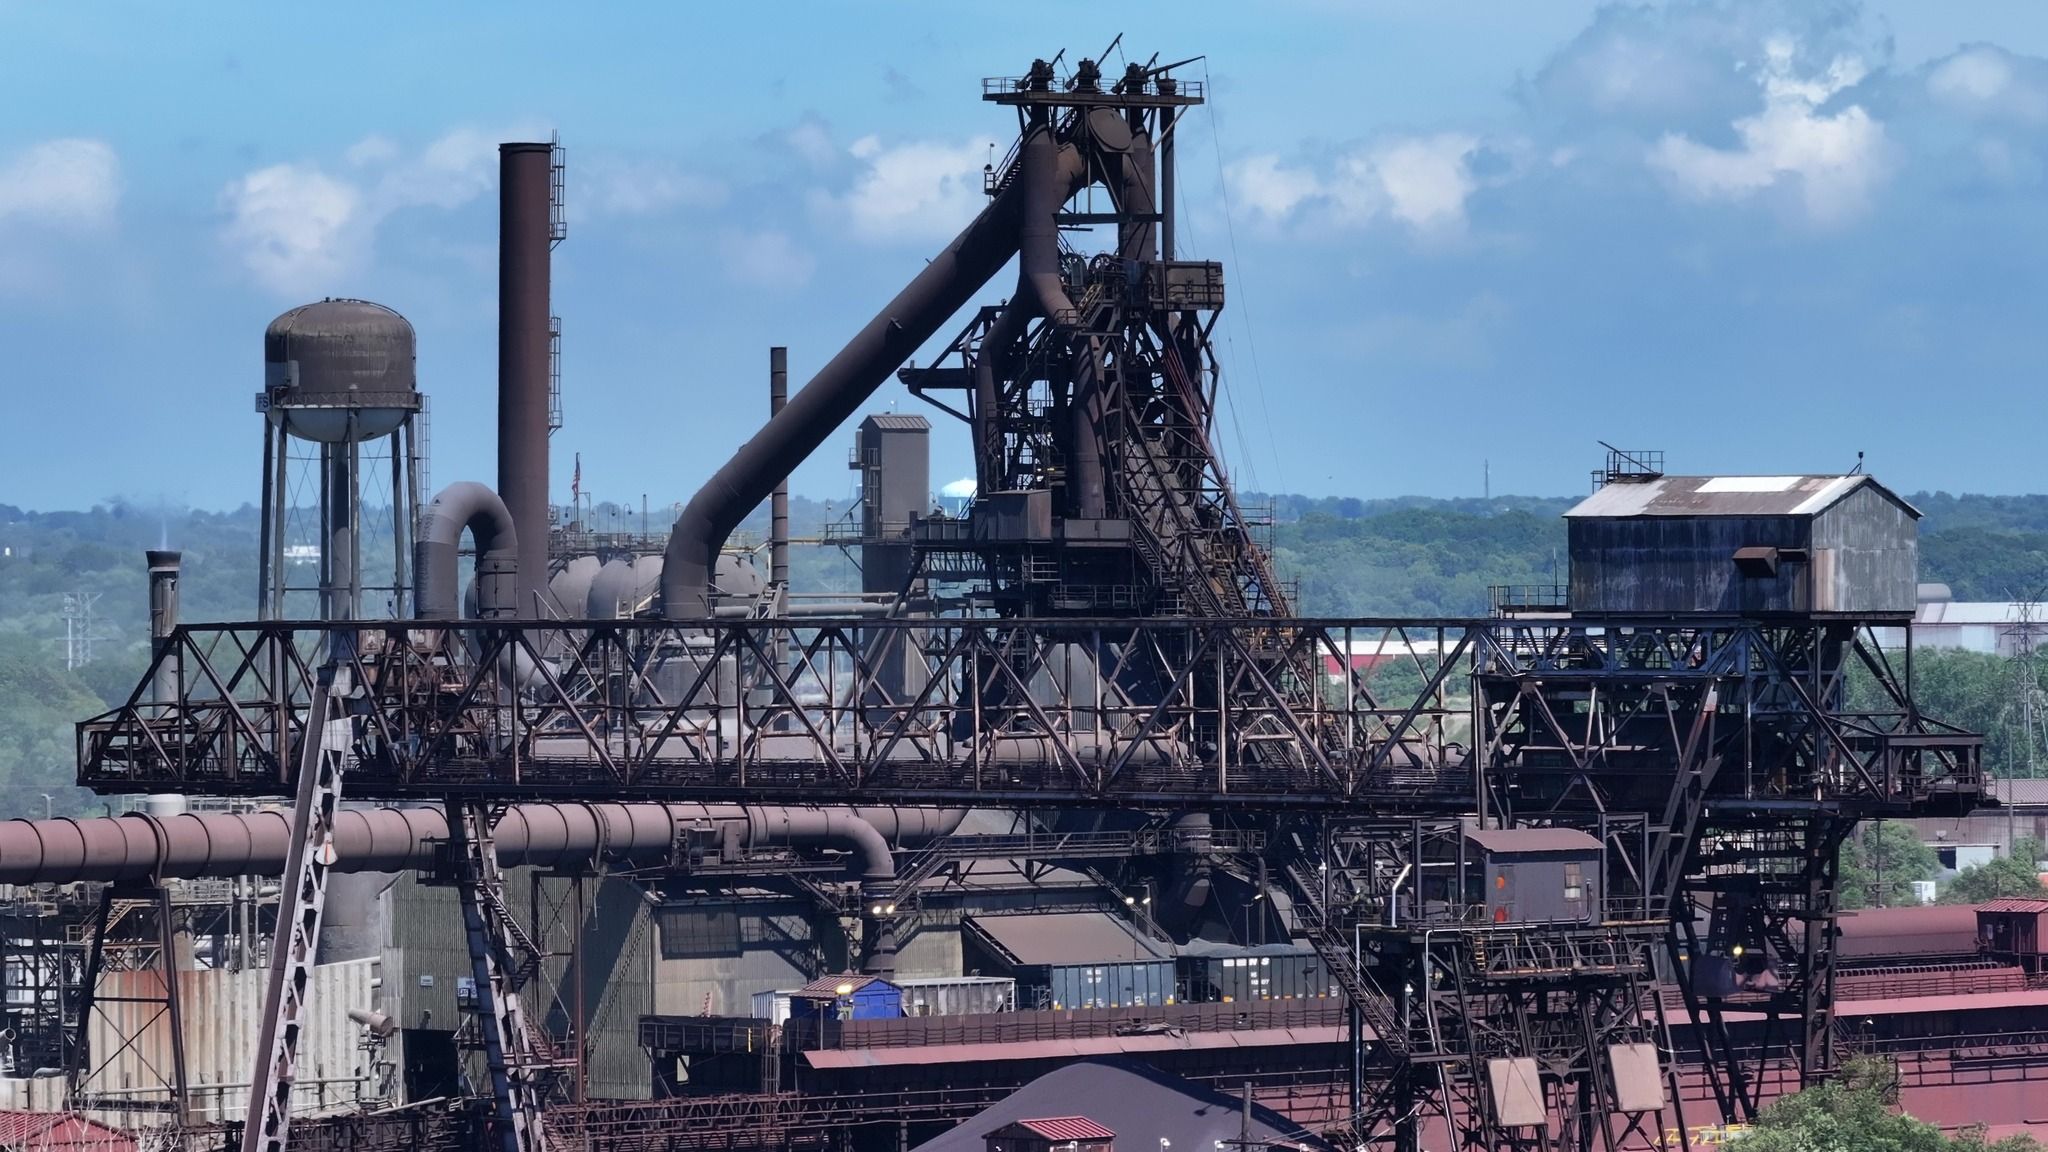
Southwest Ohio
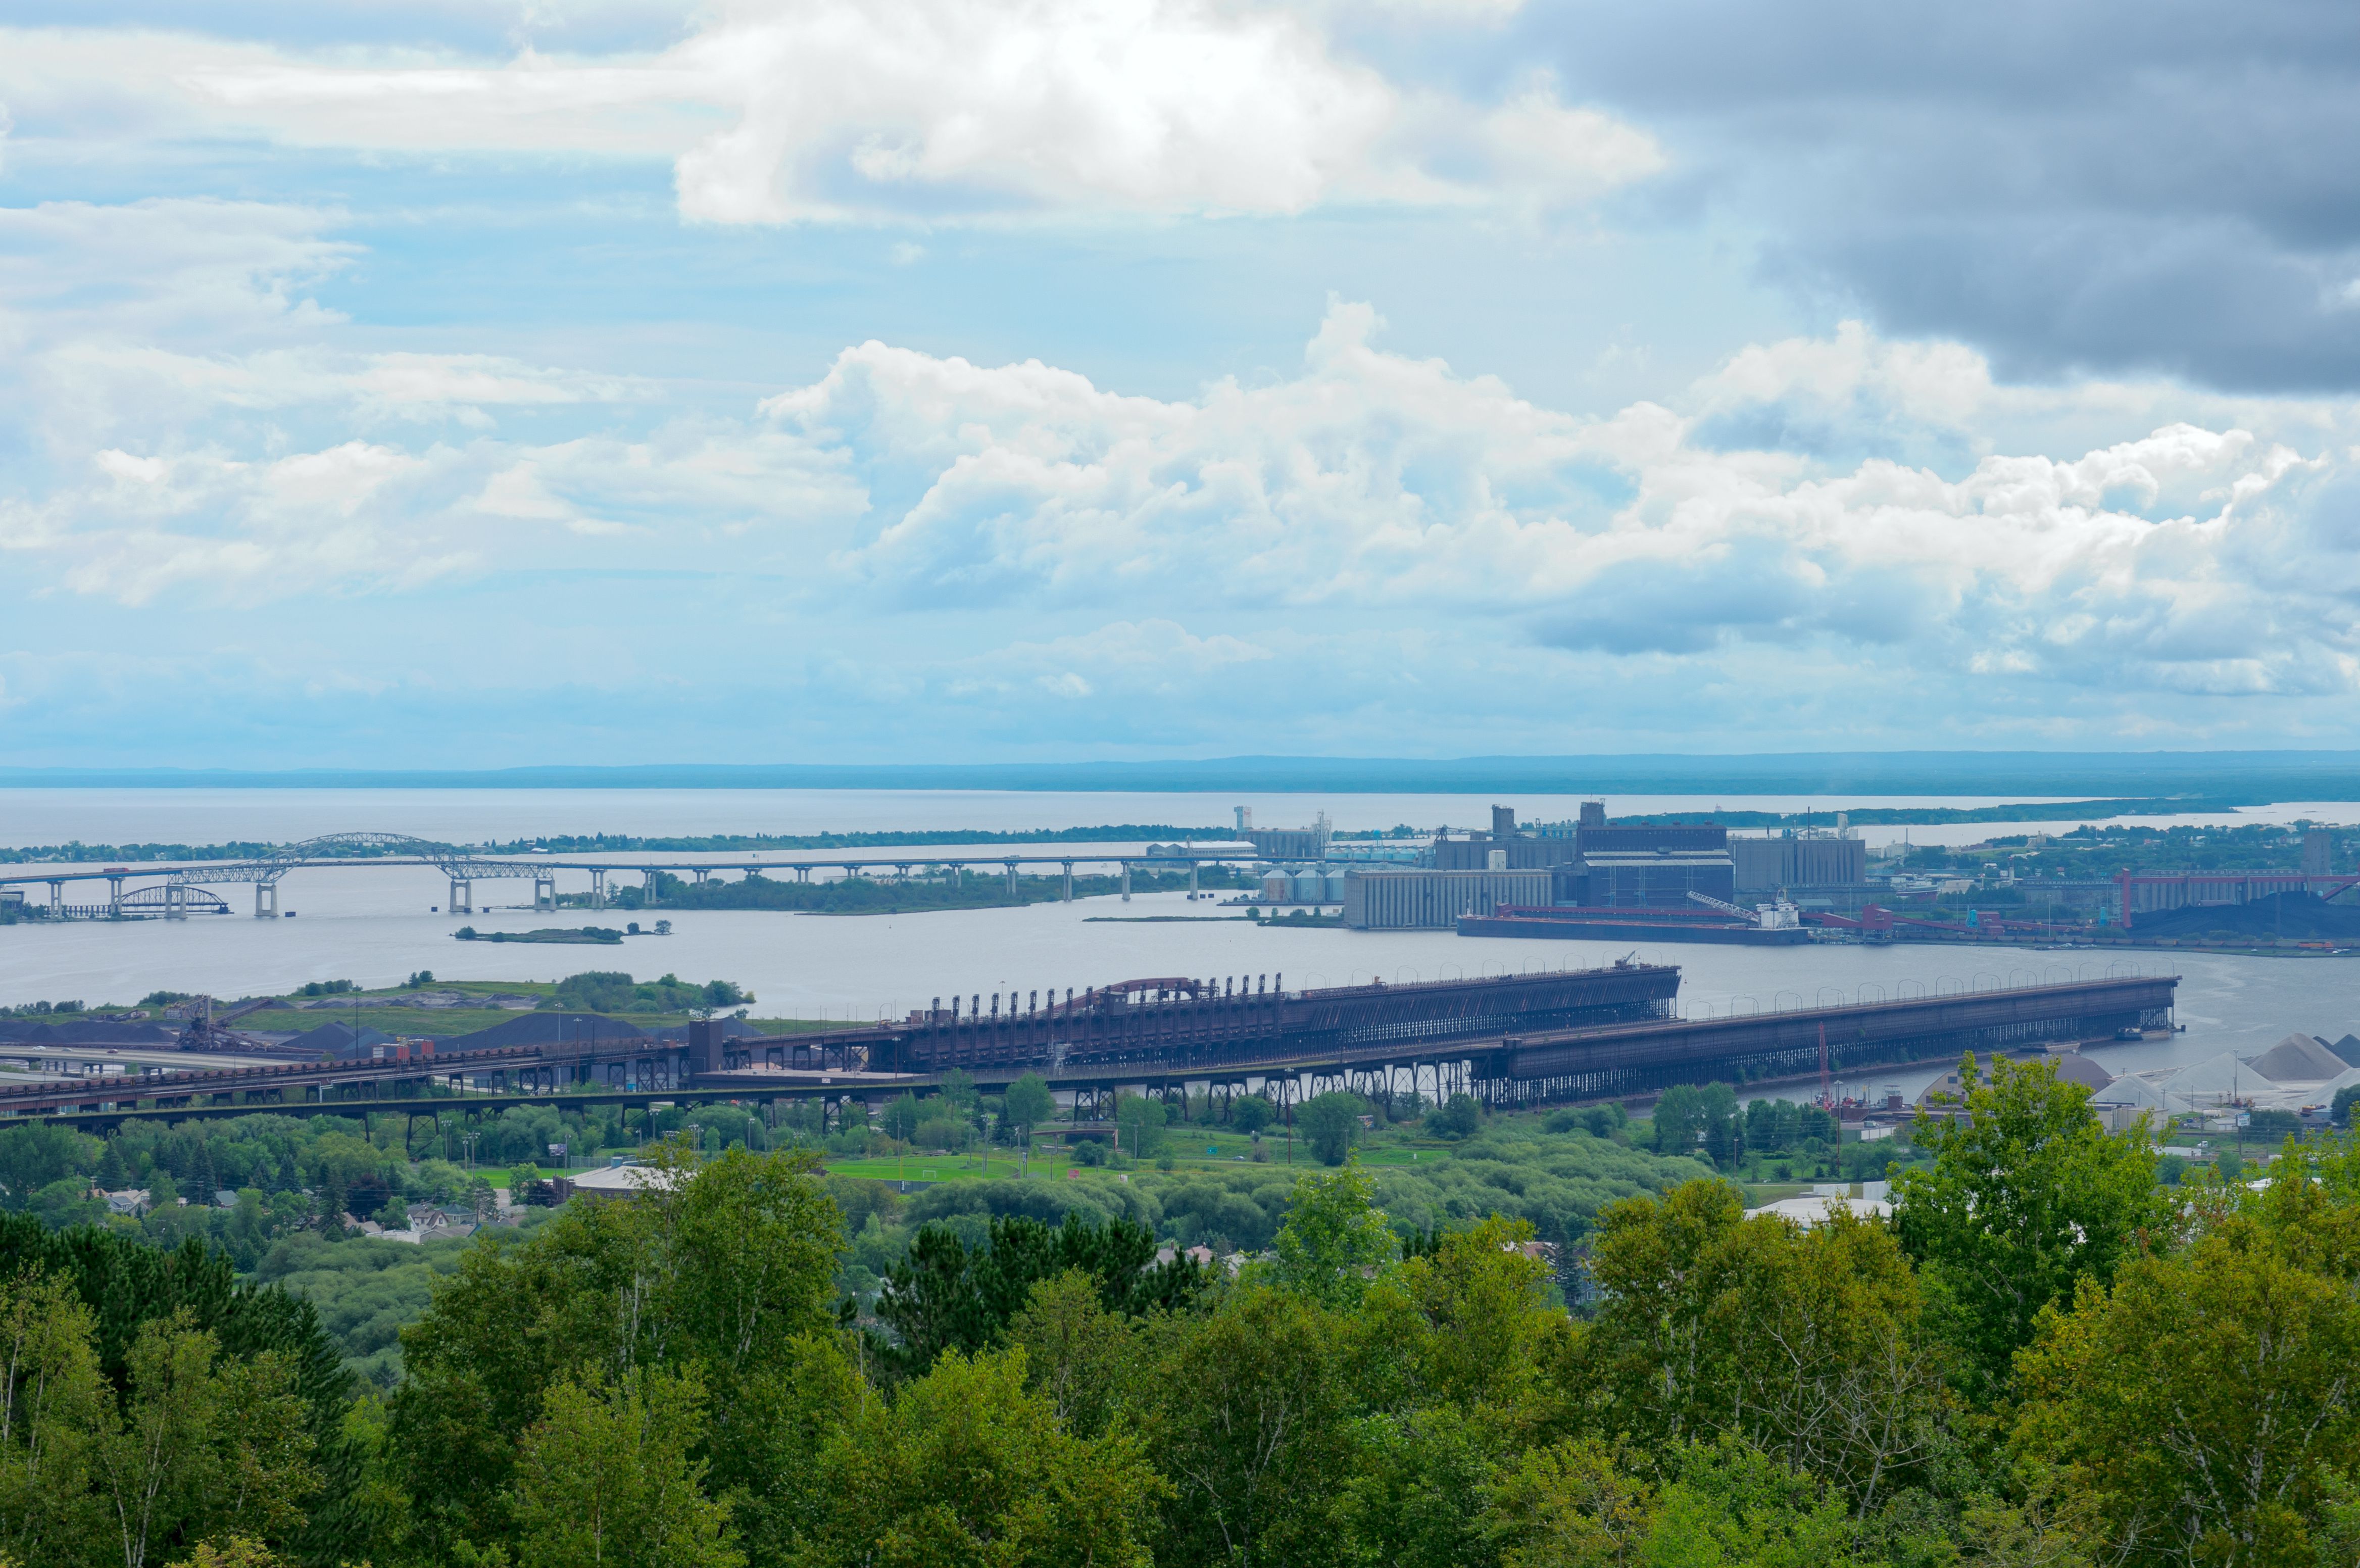
St. Louis County, Minnesota
Contact us
Questions? Contact us at equitymapper@industriouslabs.org.